Cracks Are Spreading in the US Labor Market
A closer look at the labor market reveals weakening demand, falling job quality, and signs of cyclical deterioration.
At first glance, the U.S. labor market appears to be strong. Unemployment is low by historical standards, jobs are being added, and the participation rate remains elevated.
But under the surface, something has changed.
Cracks are spreading, and the underlying data is telling a very different story—one that hasn’t yet made it into the headlines.
In this post, we’ll carefully walk through what’s actually happening inside the U.S. labor market.
Understanding these subtle labor market shifts and what they mean about the business cycle can help you determine where the overall economy is heading and how it will impact asset prices, interest rate policy, and potentially even your business situation.
Over the past several years, the U.S. labor market, especially among the 25–to 54-year-old prime-age cohort, has been remarkably strong. Participation surged after the pandemic. Job quality improved, and both employment and hours worked hit new highs.
However, the data now signals a clear inflection point.
Let’s walk through the five key labor ratios that reveal exactly where we are in the cycle and where we might be headed next.
Prime-Age Labor Ratios
For these first three ratios, we will focus on the 25-54 year old population, known as the prime-age population, as this removes the effects of an aging populace and other demographic changes.
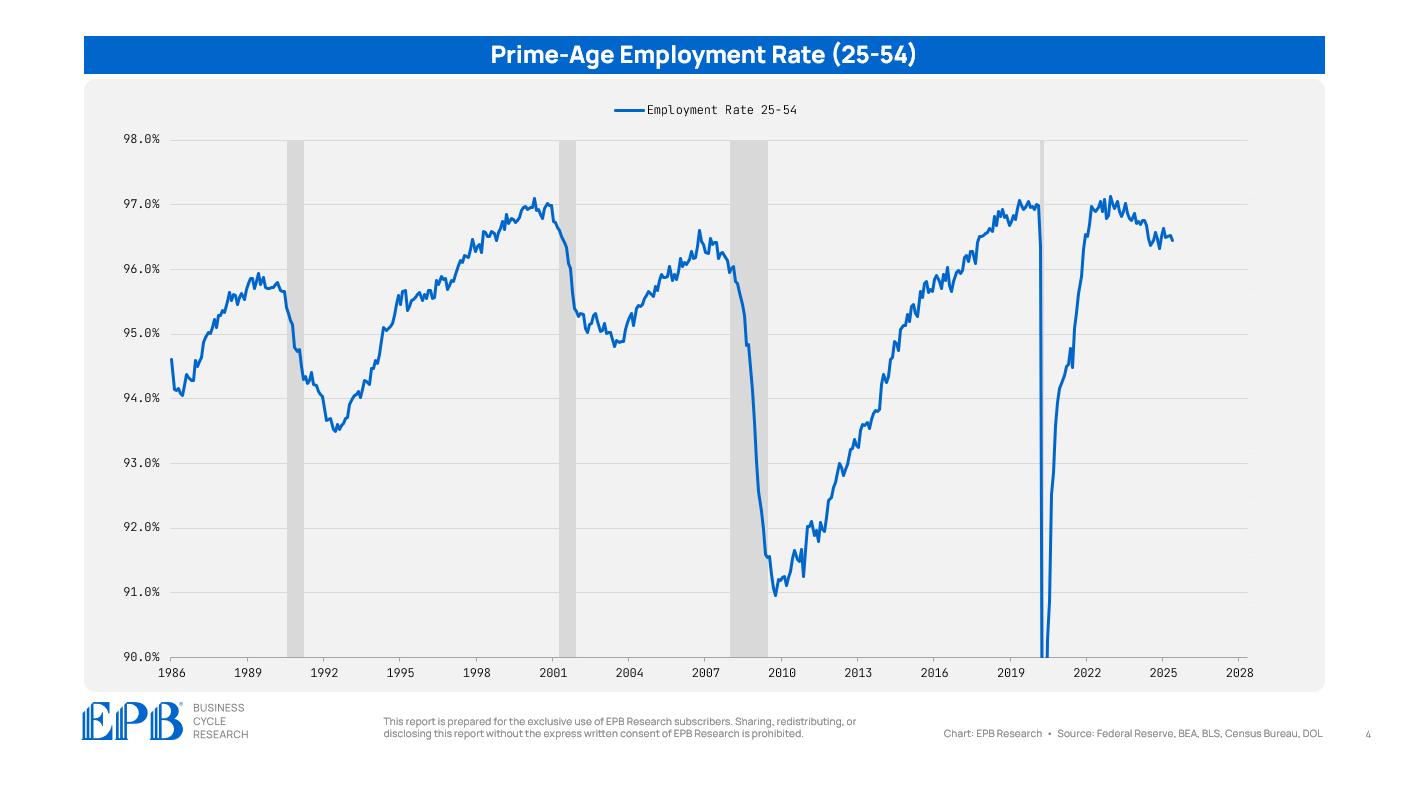
The first important indicator is the employment rate—that’s the share of the labor force that’s employed. This is simply the inverse of the unemployment rate.
The prime age employment rate has declined sharply from its cycle peak – this means there is more unemployment but its likely not from widespread layoffs.
This metric usually starts to roll over early in the downturn, as firms begin to slow hiring. Although broad layoffs haven’t started yet, this early shift indicates that slack is quietly building.
Next is the employment-population ratio, which measures employment relative to the entire prime-age population, not just those in the labor force. This metric has also stalled and is now edging lower.
That tells us that job creation is no longer outpacing population growth. It’s a broader sign that the labor market is no longer absorbing workers at the rate it once was. Growth has plateaued—even if job losses or layoffs haven’t yet accelerated.
Then we have the labor force participation rate. This surged in recent years as workers re-entered the workforce. But it, too, has flattened, just shy of its cycle high.
This means that prime-age people are still engaged and workers haven’t dropped out of the labor force, but employers aren’t hiring at the same pace. So we’re getting a mismatch: strong or at least stable labor supply, but weakening demand.
Labor Quality Worsening
Now we’re going to dive even deeper into labor quality metrics, which is where the cracks in the labor market become even clearer.
When someone is working part-time for economic reasons, it means they actually want a full-time job but cannot find one. We can then examine the ratio of people working part-time for economic reasons as a percentage of all employed individuals.
This part-time for economic reasons ratio, which is inverted in the chart, has declined from its cycle peak. This means that an increasing share of the employed population is having trouble finding the full-time work they want and have to settle for part-time work.
A similar ratio, but slightly broader, is the full-time employment ratio. This refers to the proportion of the entire labor force that works full-time.
The full-time employment ratio is declining, which means a smaller share of the labor force is employed full-time. The ratio reached its highest level ever during the pandemic boom, as labor demand was intense; however, that has clearly shifted, and the signal is now clear: employers are reducing labor intensity.
This is a classic late-cycle labor market dynamic. Faced with slowing revenue growth, margin pressure, or a deteriorating demand outlook, firms often reduce costs by slowing hiring or limiting hours, especially in roles that are easiest to scale.
Instead of resorting to immediate layoffs, they shift workers to part-time positions, delay backfilling roles, or scale back full-time capacity, thereby preserving operational flexibility while managing payroll expenses.
One of the issues in this cycle is that these late-cycle labor dynamics have been present for almost two years. Normally, businesses cannot sustain this middle ground of throttling labor intensity without shifting to layoffs more quickly.
So why are businesses doing this now, and how have they been able to sustain it for so long?
Profit Margins
When profit margins are strong, companies can afford to retain staff and absorb softening demand.
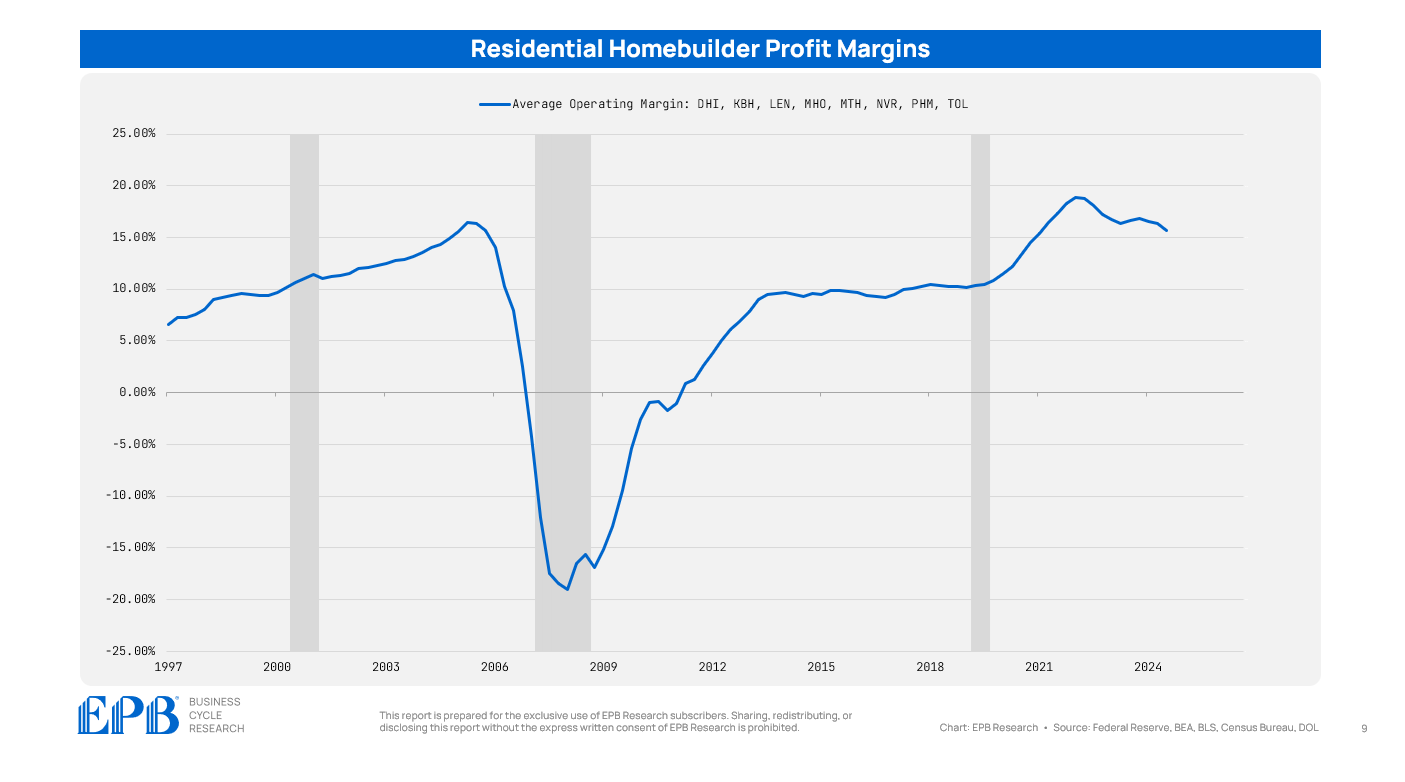
Many firms saw profit margins surge post-COVID.
Let’s take an example from the residential construction sector. The average of the major US homebuilders saw profit margins explode from 10% before the pandemic to 19% at the peak. As the economy began to cool after 2022, those margins started to compress and fell back to around 15%, but still remain well above the pre-COVID level.
That extra margin cushion allows companies to slow hiring or reduce hours without laying off employees. It’s a way to cut costs incrementally, without disrupting operations or confidence.
That’s the phase we’re in now. Not yet an outright recessionary labor market, but a clear and sustained shift in labor demand, labor intensity, and the pace of employment growth.
Late Cycle Labor Dynamics
Altogether, these five labor market metrics paint a consistent picture and one of a classic late-cycle setup.
The U.S. labor market hasn’t collapsed—but it is clearly past the peak. This is the quiet phase where hiring slows and firms reduce hours without cutting headcount. These are the cracks that form before widespread layoffs.
If you understand these early labor market shifts, you can anticipate where the job market—and the broader economy—is heading.
This is just one layer of what we track each week at EPB Research. If you found this analysis and this structured approach helpful, our premium research takes it even deeper, with weekly reports, consistent frameworks, and a clear sequential map of the full business cycle sequence.
Our goal is to help investors, management teams, and risk managers integrate this structured approach into their decision-making processes, enabling them to allocate capital and make informed, forward-looking investment decisions with confidence.
To explore our premium research and consulting services, click the button below.


Doesn't Obama care cost of health insurance incentivize employers to prefer part time workers over full time employees. I think this explains the increase in people having multiple part time employment.
This is a really clear and insightful breakdown of the U.S. labor market’s quiet shift beneath the surface. While unemployment looks low and participation seems strong, the deeper numbers—like the drop in prime-age employment and the rise in part-time work for economic reasons—are signaling that the hiring spree is slowing and companies are tightening up without outright layoffs yet.