


Industrial Production Strength (Chart Of The Week)
Industrial Production Strength (Chart Of The Week)
Our featured chart from the EPB Weekly Economic Briefing / Week 29

Industrial production growth has improved in recent months, helping to propel the narrative of a durable manufacturing upturn.
The increase in growth has been seen in both total industrial production and manufacturing production, which strips out utilities. Therefore, a full analysis of what’s driving an increase in overall production growth is needed.
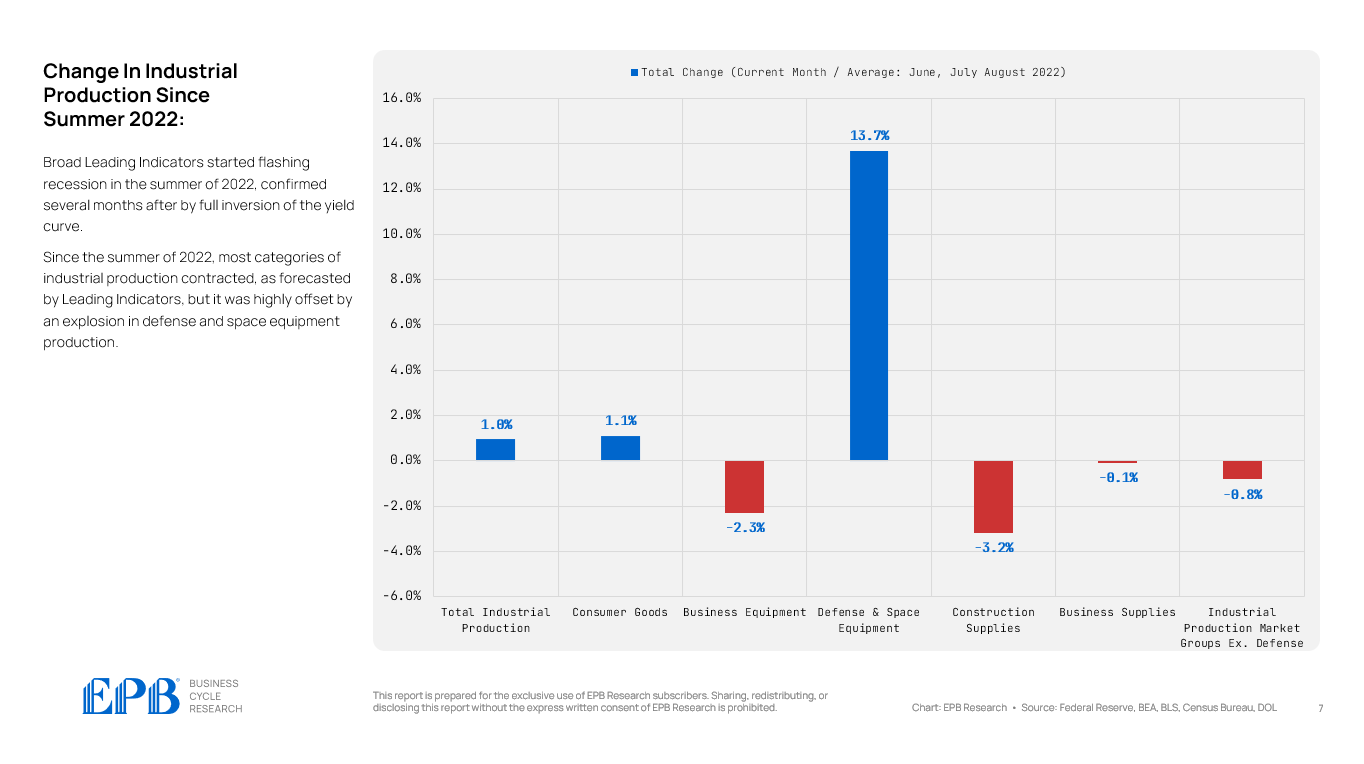
Broad Leading Indicators started flashing recession in the summer of 2022, confirmed several months after by full inversion of the yield curve.
Since the summer of 2022, most categories of industrial production contracted, as forecasted by Leading Indicators, but it was highly offset by an explosion in defense and space equipment production.
The biggest upturn in non-defense manufacturing production is coming from consumer durable goods or auto and motor vehicle products, most specifically.
The overwhelming reason for the pop in manufacturing production is non-cyclical defense production and auto production that is still normalizing from after the pandemic.
The auto sector was one of the hardest hit in terms of production backlogs and supply shortages which has caused a normally very cyclical sector to move entirely out of sync with the rest of the cyclical production sectors like business equipment and construction supplies.
This chart and analysis were featured in the EPB Weekly Economic Briefing, Week 29.
To learn more about our Business Cycle Framework and our Weekly Economic Briefing reports, click the link below.
All our reports are presented in animated video format, which requires minimal effort to consume, so you can save time and focus on what you do best.