


Real Money Supply Is Still Contracting — And Housing Is the Next Domino
Despite a continued decline in real money, the excess from past stimulus is still buffering the economy, but continued contraction will push tightening effects deeper into the business cycle.

Long before widespread job losses and contractions in headline GDP figures, monetary policy tightens beneath the surface. One of the earliest, most objective, and most reliable signals of monetary policy is real money supply because it is impacted by many endogenous variables.
Real money supply is the ultimate barometer of whether monetary policy is expansionary or contractionary, and currently, monetary policy remains restrictive.
Real money supply is the first step in a chain reaction or a sequence of events that ultimately flows through housing and manufacturing before impacting broader employment and consumption.
We carefully sequence incoming economic data into several buckets - what we call the Four Economy Framework.

Real money supply fits into the “Leading Economy” bucket, which broadly tracks the availability of money & credit as well as soft economic commitments and applications. The Leading Economy doesn’t measure any growth or employment directly, but instead provides foresight into where growth and employment trends are likely to head, which is why real money supply is such an important part of this early moving step.
The Role of Real Money Supply as a Leading Indicator
Real money supply is one of the most influential leading indicators in the Four Economy Framework. Importantly, it's not determined by the Federal Reserve or the Treasury alone, but rather it reflects a dynamic interaction between policy, the banking system, and public demand for money.
When real money supply is contracting, it means monetary policy is tight enough to suppress endogenous money creation, and fiscal stimulus isn’t offsetting the decline. Conversely, if real money supply is rising, policy is loose or being overpowered by direct fiscal injections.
A sustained contraction in real money supply typically leads to weakness in housing and manufacturing, the next dominoes in the economic sequence.
Measuring Real Money Supply
There are many competing measures of money supply, with M2 as the standard monetary aggregate. At EPB Research, we focus on the Austrian money supply measure called True Money Supply-2, or TMS-2.
TMS-2 reflects the portion of M2 that is immediately spendable. The calculation of TMS-2 starts with M2 but strips away components that are not immediately spendable or cannot be spent without delay or penalty, namely money market funds and bank certificates of deposit.
TMS-2 accounts for more than 80% of total M2 with narrow adjustments that make the measure more suitable for providing insight into consumer and business spending capabilities.
It’s important to adjust this TMS-2 measure for inflation to capture the true directional force of monetary policy, leaving Real TMS-2 as the primary money supply measure.
The chart below shows the time series of real TMS-2 back to the early 1990s.
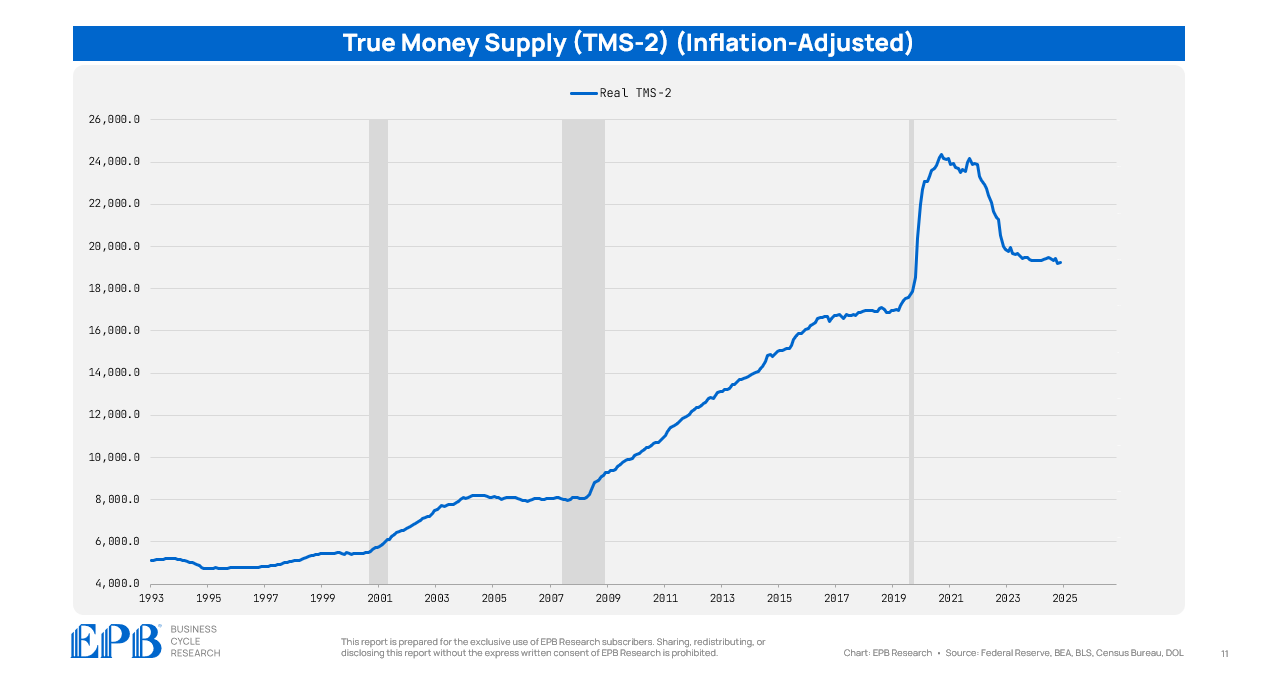
Real money supply is a critically important concept and component of the Four Economy Framework, specifically the Leading Economy bucket.
Real TMS-2 as a Leading Indicator
Starting with the longer-term picture, it is clear from the chart below that whenever there is a significant inflection in the rate of real money supply growth, economic deceleration or contraction follows.
The brisk pace of real money supply growth in the 1990s flattened out in 1999, ahead of the 2001 recession.
Similarly, the solid increase in real money supply in the early 2000s stalled in 2005 and did not grow again until mid-2008, three years of no increase in real money supply - clearly a tight monetary position.
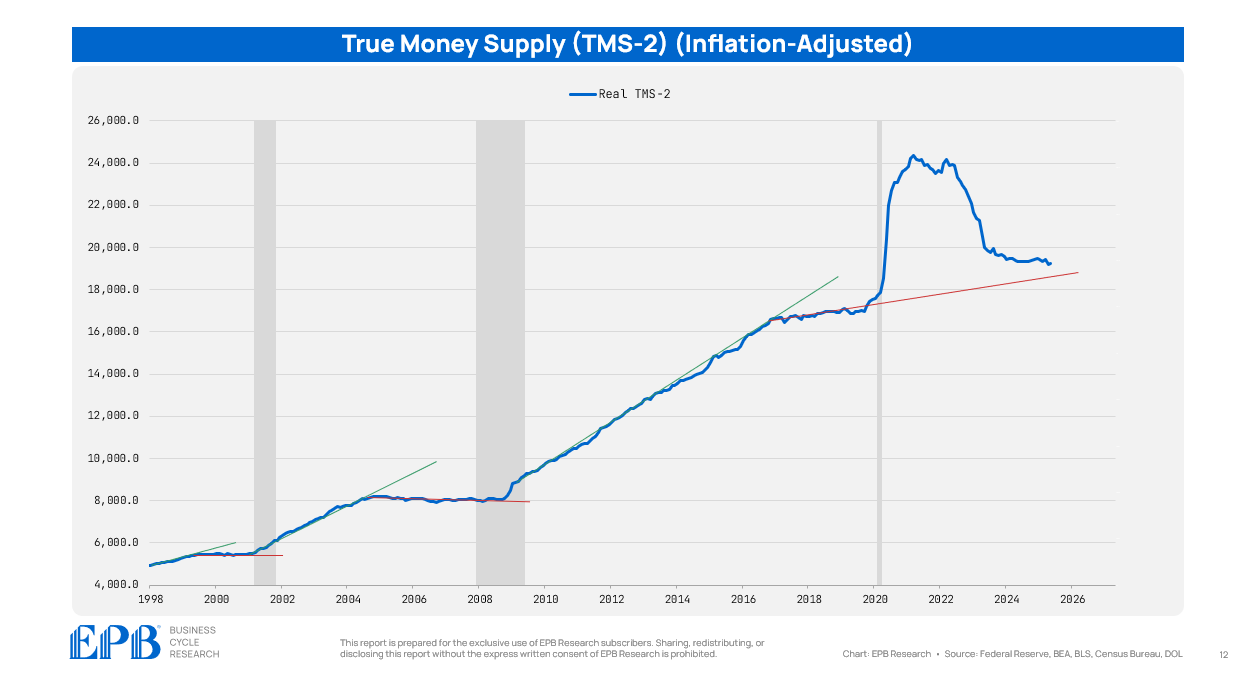
The solid pace of real money supply growth in the early 2010s finally shifted, albeit mildly, in 2017 as the Fed started to raise interest rates, leading to economic deceleration and monetary easing by 2019.
Before discussing the pandemic period and what real money supply is telling us today, let’s take a closer look at the 1990, 2001, and 2008 recessions.
Real TMS-2 peaked in 1987 and contracted steadily through 1991.
It’s important to remember that real money supply is in the Leading Economy bucket so lead times can be very long. Declines in the Leading Economy tell us that the Cyclical Economy of construction and manufacturing will decline. Once declines set in through the Cyclical Economy, then the Aggregate Economy - that part of the cycle that actually defines the recessions - is at risk of contraction.
The sequence needs time to unfold, but with the Four Economy Framework, tracking each sequential step is made easy.
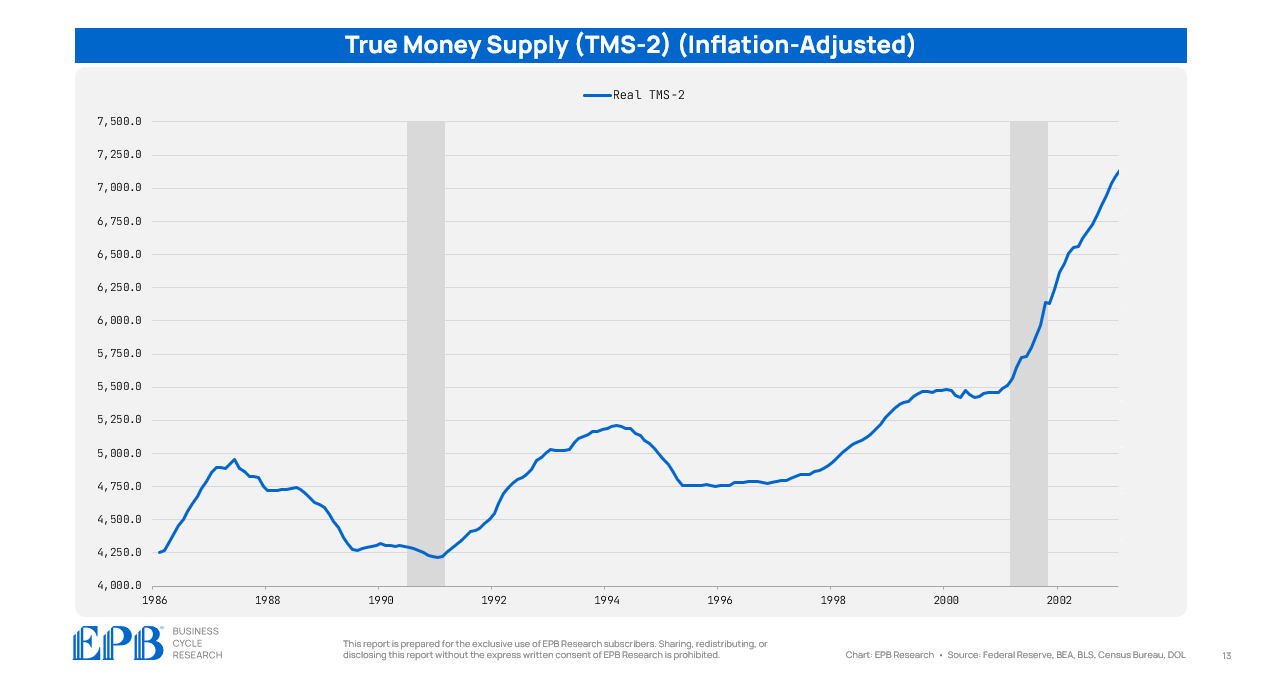
Real money supply contracted in late 1994 and 1995. While this contraction did not lead to a recession because it was not sustained long enough to ripple through the whole sequence, it did lead to an economic slowdown that was felt harshly outside the US. Real money supply is not an infallible indicator and should not be used as such. Rather, it should be used as one component to a broader Leading Economy bucket that informs the path of the highly volatile cyclical sectors of construction and manufacturing.
Real money supply stopped growing in 2005 and did not show any increase until 2008.
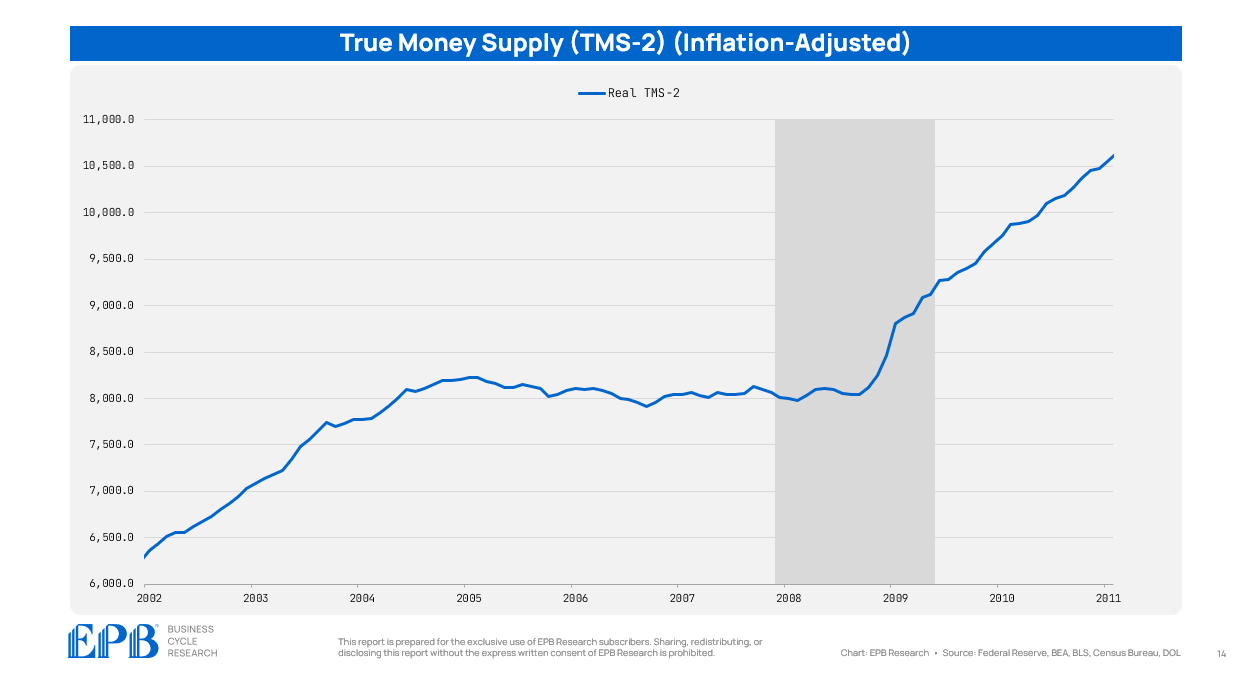
It’s very difficult for the economy to grow in real terms or move a higher level of unit volumes with contracting real spendable money. This was not a deep contraction in real money supply, but a long and sustained contraction that exposed malinvestment in the real estate sector.
Real Money Supply Today
The real money supply situation today is more complicated and requires nuance.
In 2017, real money supply growth slowed down - it was still increasing, but at a 1% annualized pace, which is relatively tight. This led to a slowdown in 2019, rate cuts from the Federal Reserve, and a neutral rate that was roughly 2.5%.
The pandemic stimulus efforts pushed real money supply 25% above that 2017-2019 trendline, ushering a boom through the housing and manufacturing sectors, high inflation, and robust economic growth for a short time.
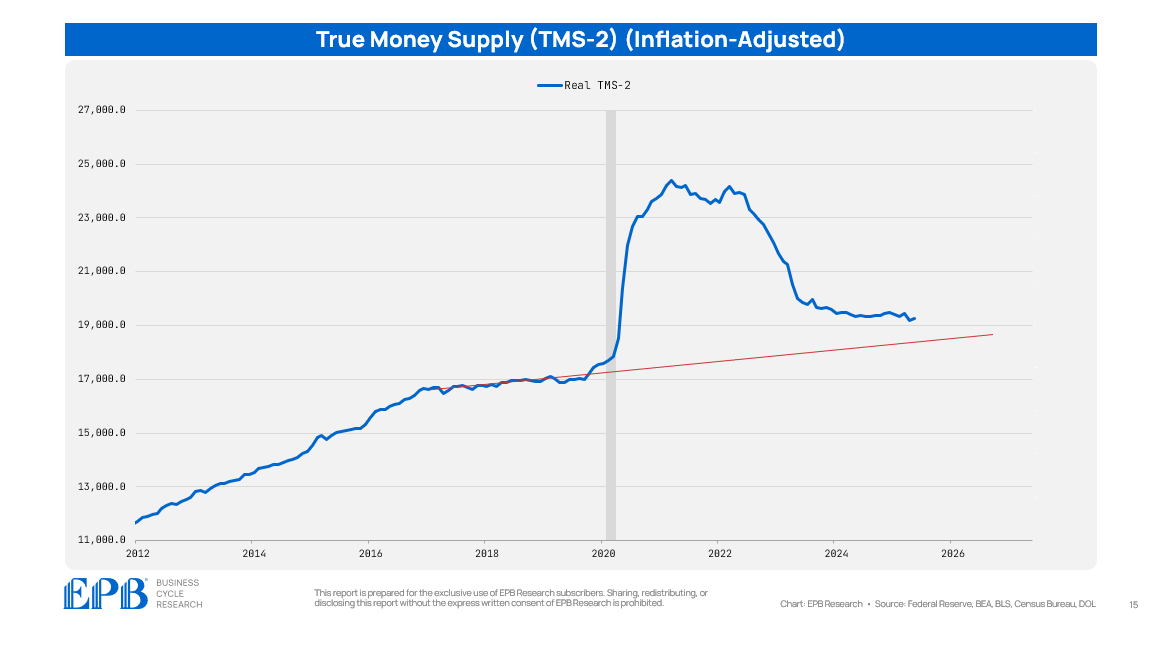
As the Federal Reserve raised interest rates and broadly tightened policy, real money supply started to contract. We can also see that even with the first round of 100bps of rate cuts, real money supply is still declining which tells us monetary policy remains tight enough to prevent increases in real money.
However, the complication with this cycle is that the stimulus from 2020 and 2021 was so great that there is still excess in the system. The current level of real money supply remains above the 2017-2019 trendline.
So while monetary policy is undoubtedly contractionary given the impact on real money supply, the economic impact has been delayed or blunted by the excess that still remains.
The Bigger Picture
The economic cycle sequence is unfolding exactly as normal. Contractions in real money supply and the broad Leading Economy basket did, in fact, translate into a decline in the Cyclical Economy (housing & manufacturing). The Leading Economy bucket peaked in early 2022, and the Cyclical Economy bucket peaked in early 2023 - this one-year lag is within normal historical context.
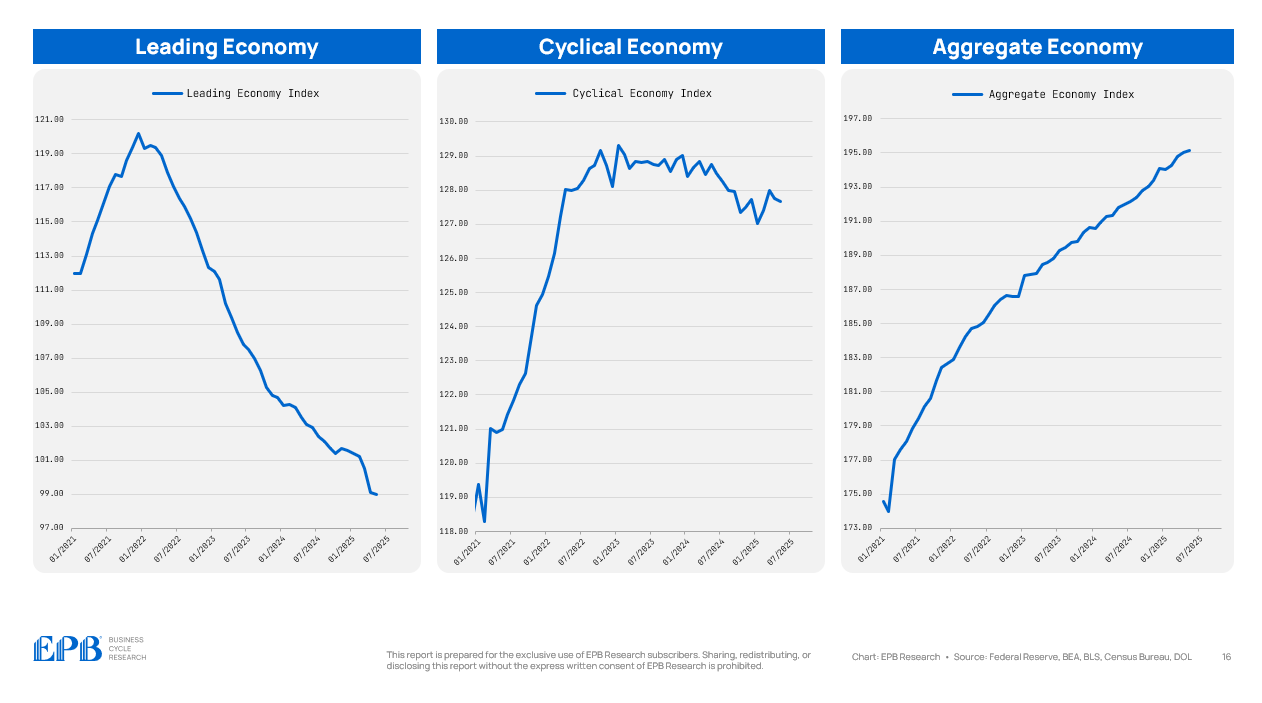
What has been different is the magnitude of the contraction in the Cyclical Economy, about 1% over 2.5 years, so slow and so mild that the impact has not been felt in the Aggregate Economy, which continues to march along.
Likely, this is due to the fact that monetary policy is contractionary, so the Cyclical Economy is struggling, but the still excess real money is providing a cushion for a more modest and gradual decline.
Should the contraction in real money supply persist, negative economic pressure will continue to move further down the sequence and more deeply into housing and manufacturing.
Real TMS-2 is one of more than 50 individual economic indicators that we track in our sequential business cycle process. The Four Economy Framework clusters these individual data points into four groups, making it easy to monitor and track consistently. This helps investors and business owners allocate capital regardless of their position in the economic cycle.
If you want to follow this entire sequence as it unfolds — with regular updates, animated video presentations, and forward-looking business cycle comments— you can subscribe to EPB Research below.
What's the justification for using real vs. nominal variables?
Fascinating