


The U.S. Housing Market Is Balanced — But Not Everywhere
National statistics show a housing market in perfect balance, but extreme regional differences exist between states with high volumes of new construction and states with very little new construction.

Inventory in the new construction market is at the highest level since the 2008 housing crisis, and this is leading to a massive divide in the housing market between states that have a lot of new construction and states that have very little new construction.

In this post, we’re going to dive deep into the unusual dynamics in the 2025 housing market and highlight the state of US housing on a national level, as well as the major differences across states, showing states that are seeing declining prices as well as states that still have absolutely no inventory.

To start, whenever analyzing the housing market, it’s important to look at what’s going on in the existing housing market as well as the new construction market. While the amount of newly constructed homes for sale is at the highest level since 2007, inventory in the existing market is still very low, far below the pre-pandemic level.
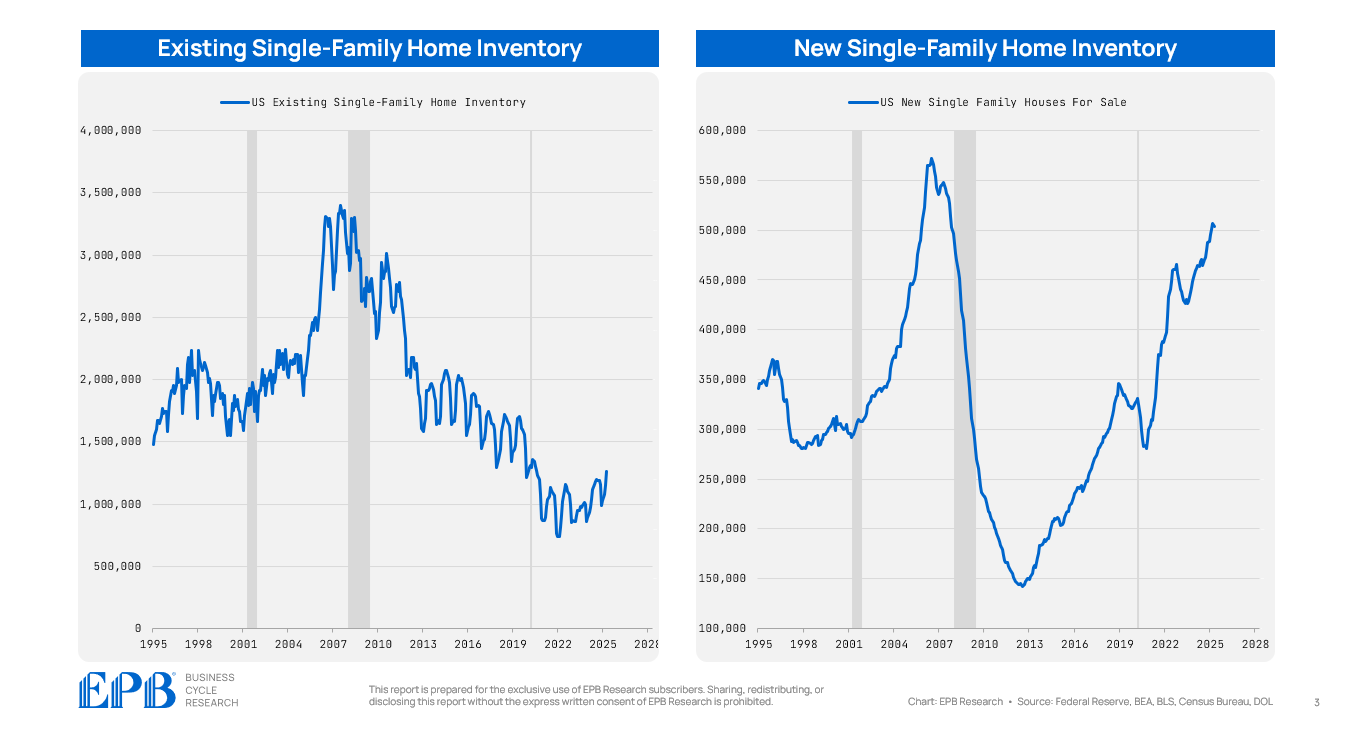
So right off the bat, there is a difference in today’s market vs. the 2008 period as there was super high inventory in both the existing market and the new home market in 2006, 2007 and 2008 while today the inventory build is only concentrated in the new construction market. Furthermore, in the new construction market, a house can be listed for sale when it’s completed or when it’s still under construction.
If we look at the roughly 500,000 new homes that are for sale, less than 25% of them are completed. In other words, 75% of the inventory that’s listed for sale in the new home market is either not started or still under construction. In the 2008 period, the last time new housing inventory was over 500,000 units, 40% to 50% of that inventory was completed, which is a much worse situation for homebuilders.

Today in 2025, once a new construction home is completed, it sells in 3 months, which is still very fast. On average across history, it takes about 4 months to sell a completed home, and the 2008 period saw a major crisis when newly completed homes were not selling for upwards of 10 months. In this situation, homebuilders aggressively cut prices to move this stale inventory.

When making an analysis of the total US housing market, we need to combine the inventory and sales data or the supply and demand for all US single-family homes, both new and existing. Across the entire US housing market, there is inventory of about 1.8 million units, which is up from the record low levels of 2022, but still lower than the pre-pandemic level of about 2 million.

However, you cannot just look at inventory, you have to look at both supply and demand or both inventory and sales volumes.
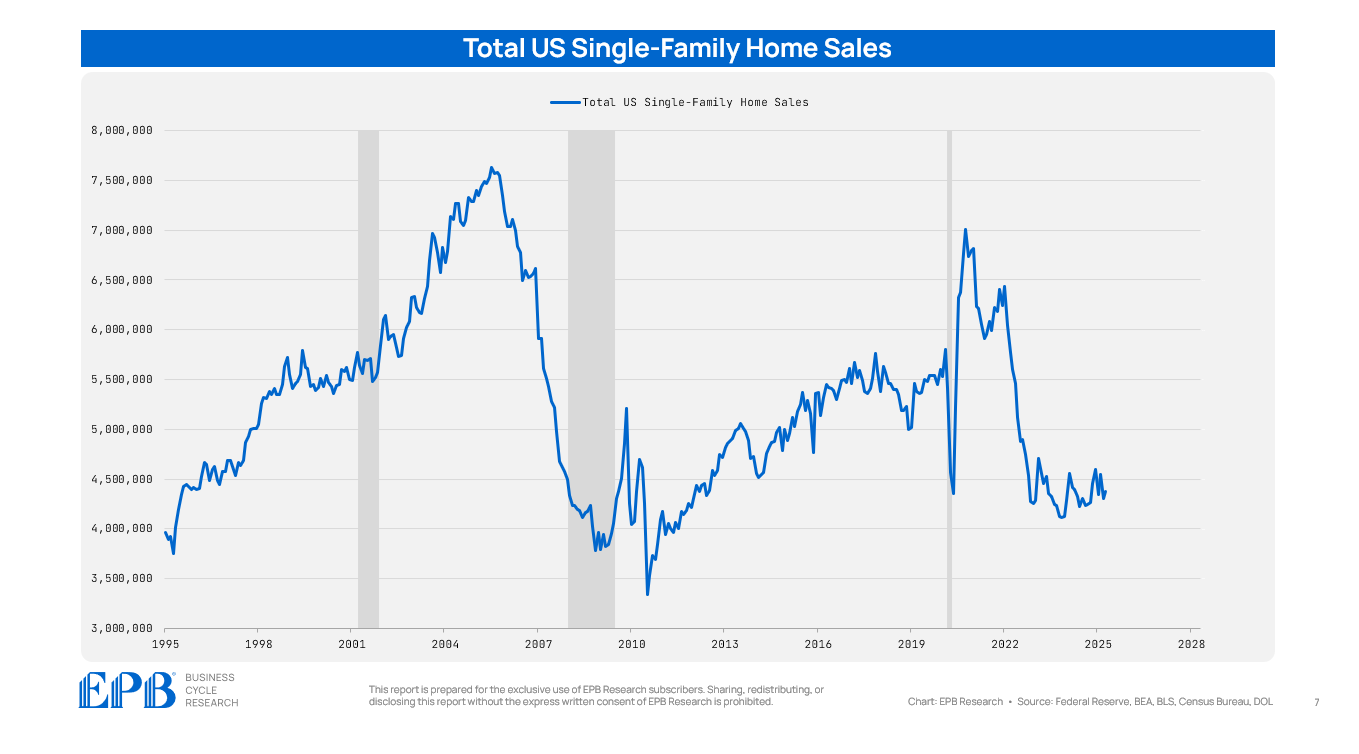
Sales volume across new and existing homes is extremely weak, under 4.5 million on an annual basis, the lowest level since 2013, and down massively from the 7 million annualized home sales we saw in the boom times of 2021 and 2022.
So there’s low inventory relative to history in the US housing market, but the sales volume is also extremely weak. The absolute best metric to square both these supply and demand measures is called the months supply or how many months of inventory are available for the current pace of sales.
Across the total US housing market, there is 5 months of supply which is almost exactly a balanced market. Between 5 months and 6 months of supply is considered perfectly balanced, where there is not too much upward or downward price pressure. So the US housing market, in 2025, finds itself in a near perfect supply demand balance when looking at the national statistics. However, we all know the US housing market is highly regional, and national data doesn’t tell the story of all local markets, which are currently showing massive variations.

But just starting high level and looking at the total US housing market, we can see a supply-demand balance that has completely recovered from the historic 2.5 level seen in 2021, now with a months supply of 5.0, the highest level since 2015.
If we look at the median listing price per square foot across the entire US, we can see pricing starting to flatten out. Since 2022, per square foot listing prices have increased at 2% per year, essentially flat or even slightly down when adjusting for inflation. This perfectly aligns with a months supply of 5.0 on a national basis.

On a national level, the median days on market is 50 in 2025, slightly below the 54 level in 2018 and 2019. This will be important context when we look at the regional differences.

On a national level, the percentage of active listings with price cuts has increased to 35%.
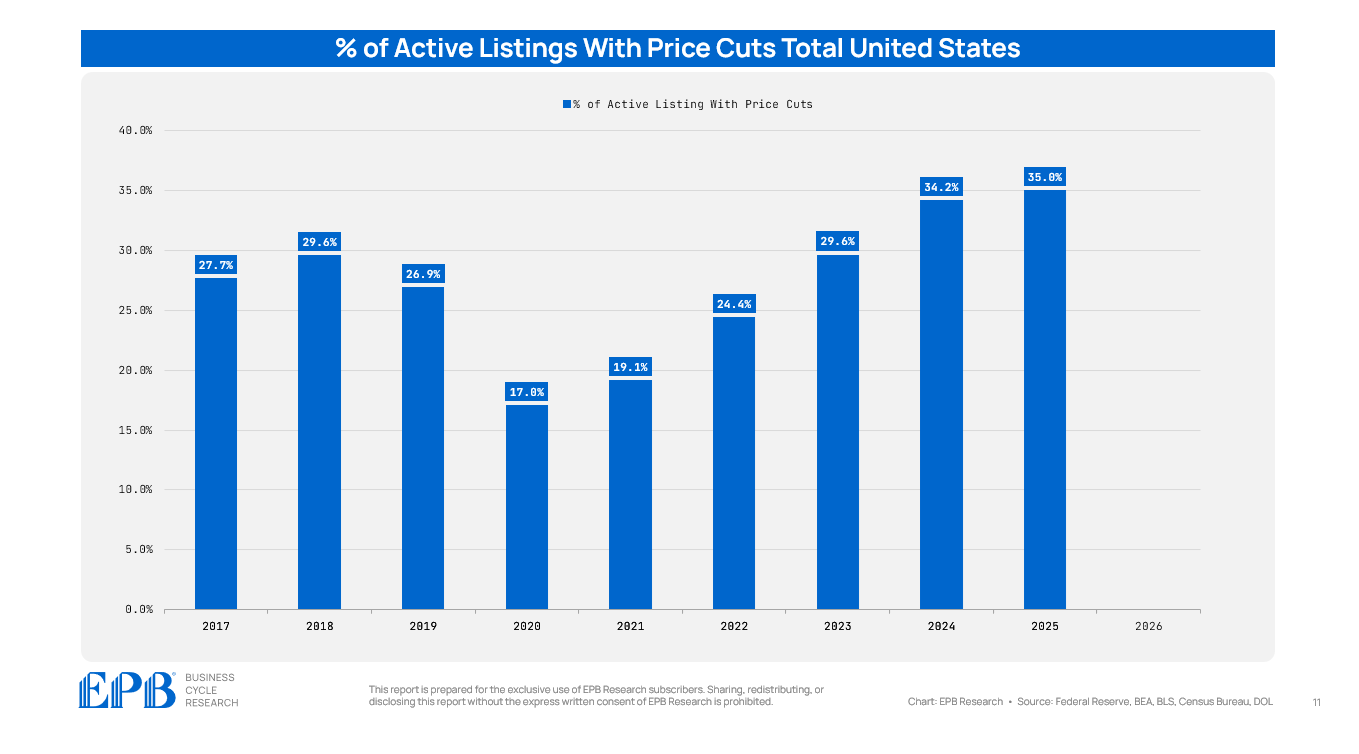
So overall, on a national level, in 2025, we are seeing a balanced market with a months supply of 5.0. This is translating to price increases of 2% per annum, roughly flat in inflation-adjusted terms, and homes selling in about 50 days, with a modest amount of price cuts needed to keep the pace of sales flowing.
But now we’re going to dive in and look at the regional differences, which have widened to the largest spread in history. The reason the US housing market is so split is because there is a lot of inventory in the new construction market, but not a lot of inventory in the existing home market.

Across the United States, there are only a handful of states where all the new construction occurs, like Florida and Texas, for example. In the Northeast, there is virtually no new construction, so the entire market is existing homes.
This map shows the major regional differences. This map shows the active listing count or the inventory level in each state compared to before the pandemic in 2018 and 2019. Red states are the ones where inventory is HIGHER than it was before the pandemic, and green states show where inventory is LOWER than it was before the pandemic.

The three states showing the largest surge in inventory are Colorado, Texas and Florida, three states with a high volume of new construction.
Inventory in these three states are an average of 30% HIGHER than before the pandemic.
On the flip side, the Northeast has an incredibly unhealthy inventory situation. Inventory in Connecticut is 76% LOWER than it was before the pandemic. New York has 44% less inventory.
The dynamics in the US housing market in 2025 are such that states that have a lot of new construction are starting to see exploding inventory but states with no new building have a complete inventory crisis.
The national housing market is balanced with a months supply of 5.0, but the average is deceiving as there are states with exploding inventory and states with collapsing inventory, all balancing out to what looks like normal on a national level.

If we take the states with the highest inventory surge, Colorado, Texas, and Florida, and we compare them to the states with crashing inventory like New York, New Jersey, and Connecticut, we can see just how split the housing market is in 2025.
The median listing price per square foot in the three no-inventory states is $350 in 2025, compared to $250 in the three high-inventory states. Also, the median price per square foot in the no inventory states continues to rise, up 15% from 2022, compared to flat in the high inventory states.

When we look at the median days on the market, remember the entire US data, which shows median days on the market down a touch compared to 2018 and 2019.
The median days on the market is way lower in 2025 compared to 2018 in the no inventory states, and it’s higher by a day in the high inventory states. The market remains incredibly tight in states with no new construction and no inventory, but it’s rapidly softening in the states with high levels of new building.

The percentage of inventory with price cuts is 21% on average in NY, NJ and CT, the same as 2018.
The percentage of inventory with price cuts is almost 40% in the high inventory states, above the level in 2018 and 2019.

The overall takeaway is that the US housing market is quite balanced based on national statistics and this is important when thinking about national home price data. We’re unlikely to see major drops in national home prices with a relatively balanced market.

However, the regional differences are huge. There are 11 states with inventory that’s higher than 2018 and in those markets we are seeing rising price cuts, longer days on market, and declines in home prices. The states leading the decline are Colorado, Texas and Florida. States like Utah, Nevada and Washington are also seeing signs of weakness.
The vast majority of states, particularly throughout the Northeast, have such low levels of inventory due to a major lack of new construction that pricing remains quite strong and will likely stay that way until there are widespread declines in the labor market as there is no other forcing function to get inventory to market in these states.

It’s an important point that all these shifts we are seeing in the housing market are all coming without major disturbances to the overall labor market. Any declines in the national labor market will intensify these trends that are already in place.
This is the state of the US housing market at roughly the midpoint in 2025.
At EPB Research, we focus on the housing market, particularly new construction, since residential housing activity is a critical part of the overall Business Cycle.
Our goal is to help institutional investors and business leaders forecast economic turning points and allocate capital with confidence, using our proven Four Economy Framework.
If you’d like to learn more about EPB Research and our weekly client reports or our institutional consulting services, click the link below.
Good summary of the current market. Still very much a bifurcated mess, particularly here in Texas. We have DFW submarkets with inventory that is double 2018/2019 levels. When you see a statewide average, remember that real estate markets are national, regional and local.
Excellent. Great maps. Helpful to see difference between Texas and New York, mind boggling, gonna be a slog to work this out. Thank you