Watch The (Modified) Duncan Leading Index
A comprehensive review of the structure of the economy and which segments you should track to understand the state of the Business Cycle.
The Duncan Leading Index was made popular by economist Wallace Duncan and it was designed based on the concept that changes in the economy stem from a few select categories.
Despite popular opinion, most segments of the economy do not contract and are generally extremely stable.
We often hear comments such as:
“The consumer is fine.”
“The consumer is holding up the economy.”
“We are a services economy.”
These comments are generally accepted as true given the frequency that they are repeated, but the reality is that these comments are exactly the opposite of what you want to focus on if your goal is to track and get ahead of major changes in the Business Cycle.
In this post, we’ll review the structure of the economy and which segments you should track to understand the current state of the Business Cycle.
The economy has four primary categories: private consumption, private investment, net exports, and government spending.
It’s true that private consumption, or “the consumer,” makes up about 70% of total GDP, but that leads to the incorrect conclusion that the consumer drives the ebbs and flows of the Business Cycle.
The Duncan Leading Index involves tracking three narrow segments of the economy: durable goods consumption, residential investment, and non-residential investment.
At EPB Research, we’ve found that it’s very easy to improve the Duncan Leading Index by tracking durable goods consumption, residential investment and business equipment investment.
We call this the “modified” Duncan Leading Index, and it’s superior to the original construction because the nonresidential investment in structures and intellectual property investment categories are not leading indicators but rather lagging.
The chart below shows investment in nonresidential structures, including hospitals, office buildings, and shopping centers.
As the chart shows, this category is not a leading indicator, often reaching a peak during a recession and forming a bottom way after a downturn is over.
So, we are left with three narrow categories of the economy that are responsible for virtually all the booms and busts: durable goods consumption, residential investment, and business equipment investment.
Although these three categories make up less than 20% of the economy, they are responsible for all its changes and cyclicality.
This analysis is far different from the more common “watching the consumer” analysis since durable goods consumption, the only consumer category in this modified index is less than 10% of the economy!
When you track or focus specifically on “the consumer” and all consumer spending, you capture spending on healthcare services, food, clothing, and many other nondiscretionary items that must be consumed during a recession or an economic boom.
In nominal dollars, the components of the modified Duncan Leading Index, what we call Cyclical GDP, have contracted in 17.5% of the quarters since 1956. Total GDP has only contracted in 2.9% of the quarters, and the non-cyclical part of the economy, what most people focus on, has only contracted in 1.5% of the quarters since 1956.
Why focus on this part of the economy at all?!
The modified Duncan Leading Index takes our three cyclical categories of GDP and plots them as a percentage of GDP. You can see that these three categories swing from 14% of GDP to 22% of GDP, falling sharply into recessions and rising rapidly in expansions.
These three categories are highly impacted by changes in the availability of money and credit. When the Federal Reserve started to tighten monetary policy in early 2022, this index started to decline, which was very much expected.
However, we’ve seen a rather mild decline, falling just 1% of GDP, which is not much in the context of what was a very extreme monetary tightening cycle.
When we decompose this index into its three components, we can see exactly what’s going on with the Business Cycle, which is why it’s so critical to monitor these areas of the economy.
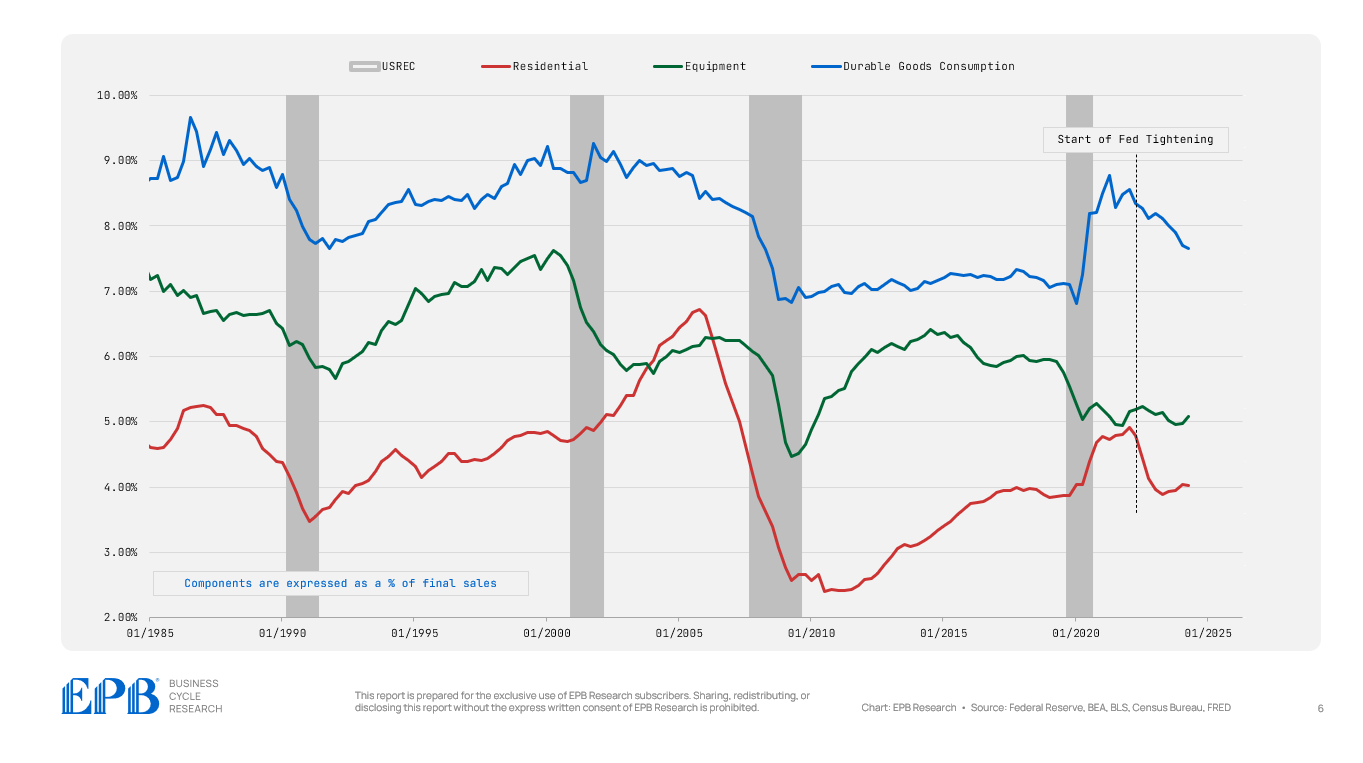
This chart shows the three components of the modified Duncan Leading Index. It’s clear that these three categories tend to move in sync as they are all impacted by changes in monetary policy.
When the Federal Reserve started tightening monetary policy in early 2022, we saw the durable goods consumption and residential investment categories fall as expected, but the business equipment investment category did not.
How could this be? Why would a very interest rate sensitive sector not decline after a huge tightening of monetary policy?
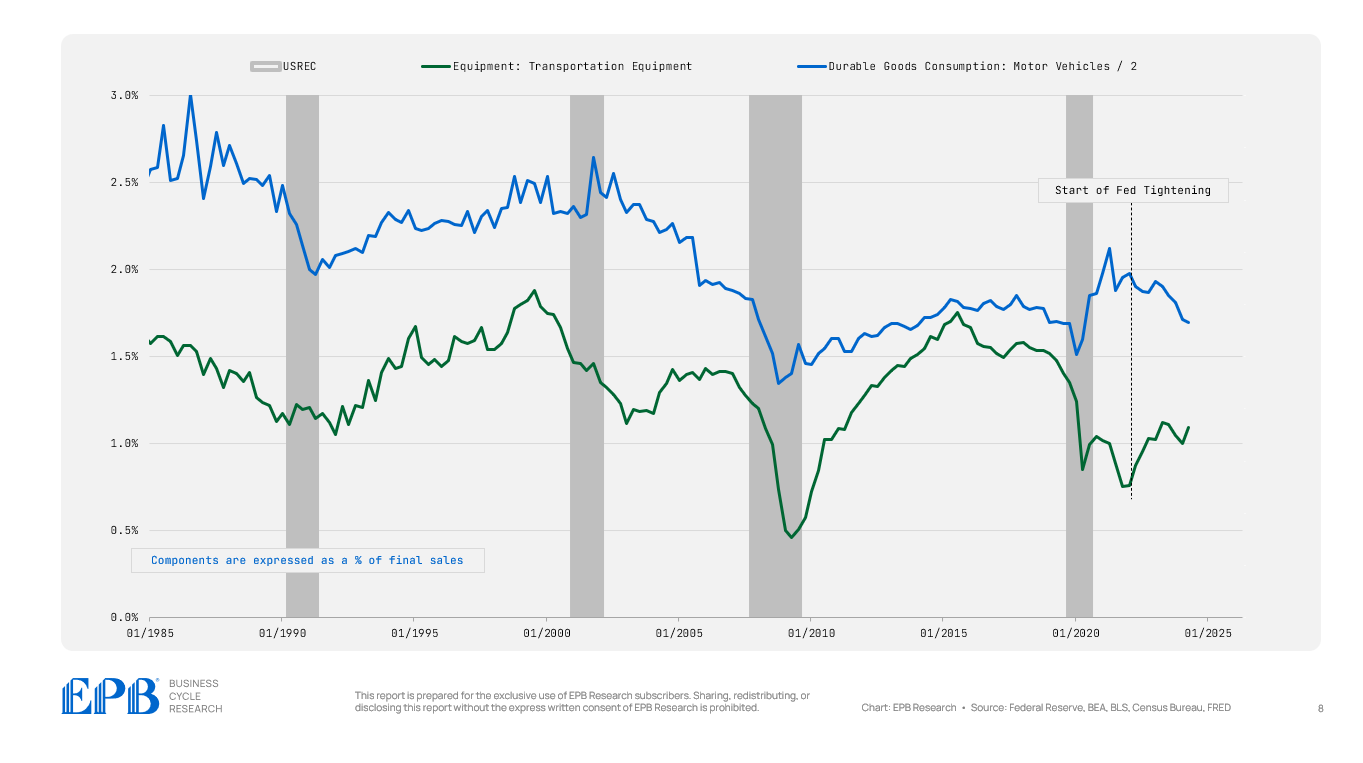
Perhaps the most important segment within the business equipment category is auto or transportation equipment. Supply chains impacted this industry more significantly than any other sector of the economy.
In 2021 and 2022, the economy was booming, but auto equipment investment plunged. This was extremely unusual and completely out of sync with the normal order of the Business Cycle.
Then, when the Federal Reserve started to tighten monetary policy, auto equipment investment surged, completely the opposite of what normally happens.
Even more unusual is that auto equipment investment has diverged from auto consumption due to the atypical cycle after the pandemic.
Auto consumption, which is part of durable goods consumption, is trending lower, while auto equipment investment is trending higher.
This will re-converge with time as these issues normalize but this has given the illusion that parts of the economy are insensitive to interest rates.
Total vehicle sales are very cyclical and respond to monetary tightening, but this cycle was thrown off.
Vehicle sales declined while the economy was booming and then increased when the economy was slowing. This was all related to supply chains and distortions. Now, we are seeing auto sales trend lower while auto equipment investment is rising, clearly a trend that is due to normalization and not an interest rate-insensitive economy—or a higher neutral rate, as it’s being mischaracterized.
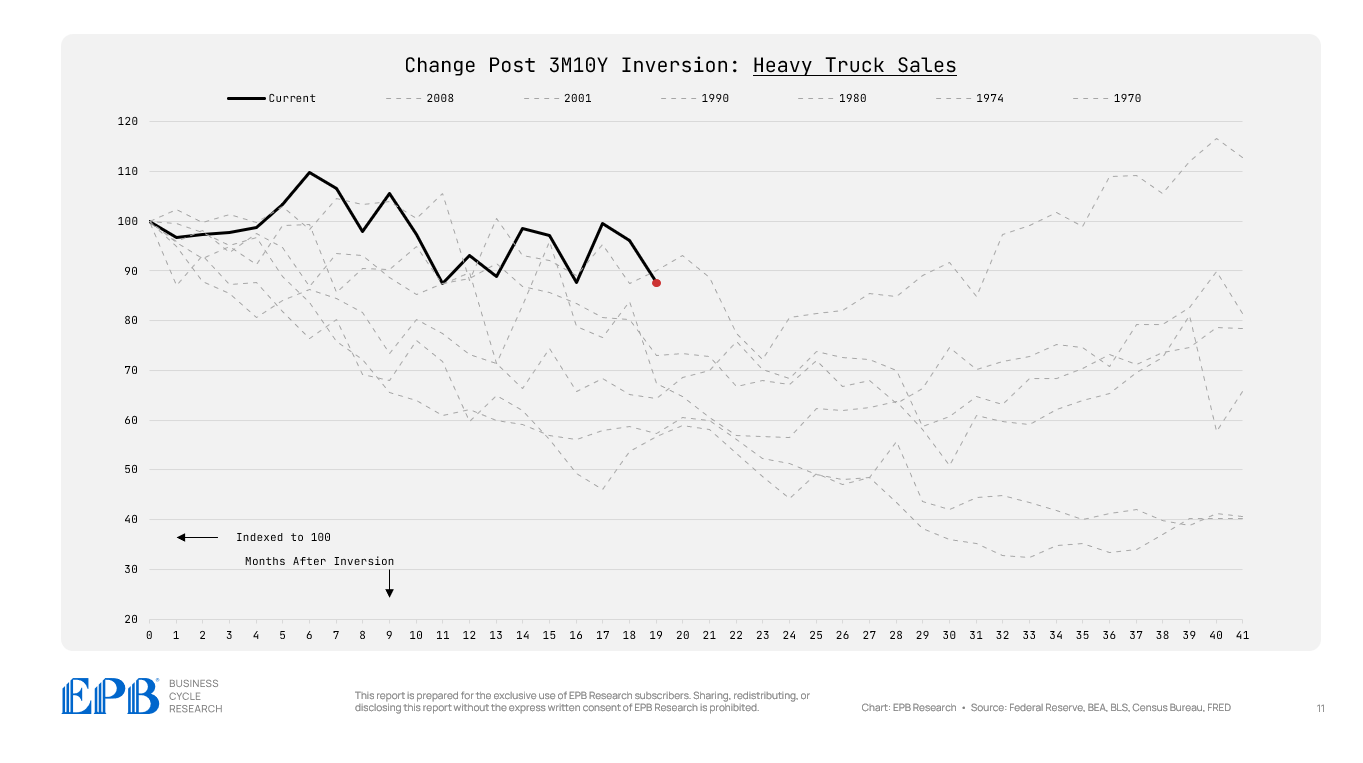
We can see this trend even more clearly with heavy truck sales, a component of total auto sales.
Normally, heavy truck sales are one of the most cyclical elements in the economy. Due to supply chains, heavy truck sales fell sharply in 2020, 2021 and 2022 as the economy was booming. Then, as the Fed tightened, heavy truck sales exploded higher. This is what caused large parts of the cyclical economy to appear interest rate insensitive.
Now, heavy truck sales are rolling over again, more in line with post tightening cycle environments.
The inversion of the yield curve is a critical signpost in the Business Cycle. This chart shows the trend of heavy truck sales after the yield curve inverted in all instances going back to the 1960s.
Today, in black, it’s clear that heavy truck sales are doing better than normal in the 20 months after the yield curve inverted.
However, this trend will not last. It will start to converge towards the normal pattern, which will then impact auto equipment production, slowing the broader cyclical part of the economy that we track with the modified Duncan Leading Index.
To summarize, it’s critical to watch the narrow sectors of durable goods consumption, residential investment, and business equipment investment. These sectors make up what we call the modified Duncan Leading Index and it should be what you follow since these categories are the ones that drive the ebbs and flows in the economy.
Other sectors of the economy hardly ever contract - less than 2% of the time!
All the changes happen in the cyclical economy and the story about what’s been happening in the Business Cycle can always be explained by the cyclical sectors.
For regular updates on the cyclical economy and this modified Duncan Leading Index, check out the EPB Research subscription services, where we update the trends across the Leading, Cyclical, and Aggregate Economy on a regular basis – never deviating from the trends that actually matter to the overall ebbs and flows of the Business Cycle.


Excellent work!
thanky for your work!
i was looking for open source data and want to understand your graph 6! How did you get the percentages?
Would i get the results by using the following data?
https://fred.stlouisfed.org/series/PCEDG
https://fred.stlouisfed.org/series/PRFI
https://fred.stlouisfed.org/series/PNFIC1