


All Eyes On Profit Margins (Chart of the Week)
Our featured charts from the EPB Weekly Economic Briefing / Week 34

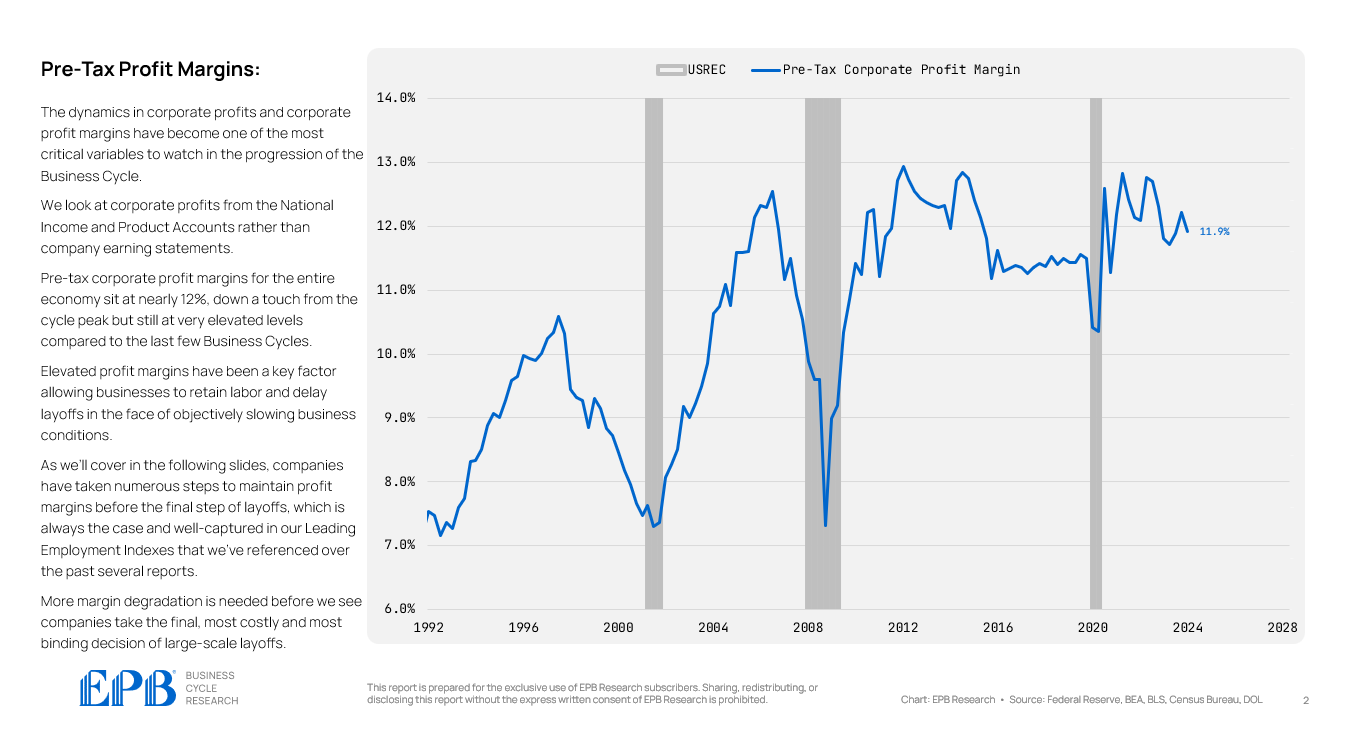
The dynamics in corporate profits and corporate profit margins have become one of the most critical variables to watch in the progression of the Business Cycle.
At EPB Research, we look at corporate profits from the National Income and Product Accounts rather than company earning statements.
Pre-tax corporate profit margins for the entire economy sit at nearly 12%, down a touch from the cycle peak but still at very elevated levels compared to the last few Business Cycles.
Elevated profit margins have been a key factor in allowing businesses to retain labor and delay layoffs despite objectively slowing business conditions.
Companies have always taken numerous steps to maintain profit margins before the final step of layoffs, which is well-captured in our Leading Employment Indexes, which we’ve referenced over the past several reports.
More margin degradation is needed before companies make the final, most costly, and most binding decision to make large-scale layoffs.
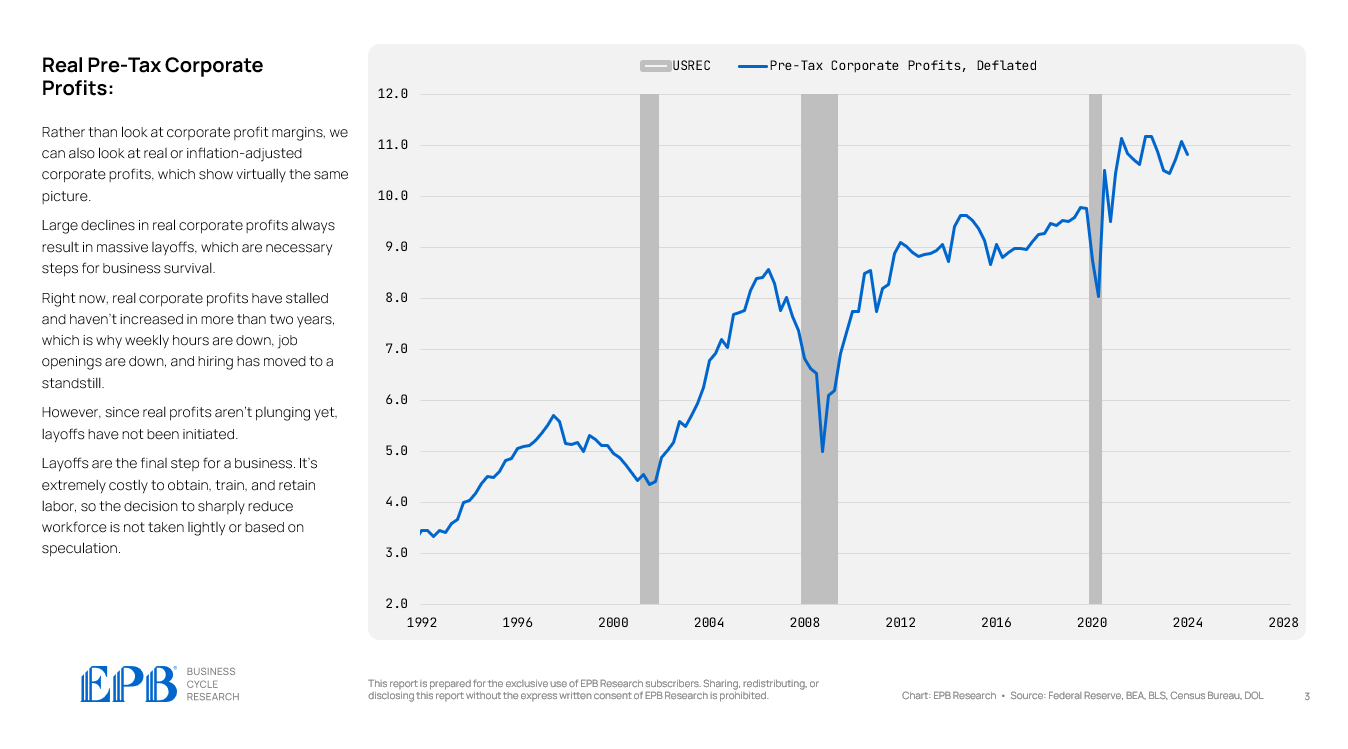
Rather than corporate profit margins, we can also examine real or inflation-adjusted corporate profits, which show virtually the same picture.
Large declines in real corporate profits always result in massive layoffs, which are necessary steps for business survival.
Right now, real corporate profits have stalled and haven’t increased in more than two years, which is why weekly hours are down, job openings are down, and hiring has moved to a standstill.
However, since real profits aren’t plunging yet, layoffs have not been initiated.
Layoffs are a business's final step. It’s extremely costly to obtain, train, and retain labor, so the decision to sharply reduce the workforce is not taken lightly or based on speculation.
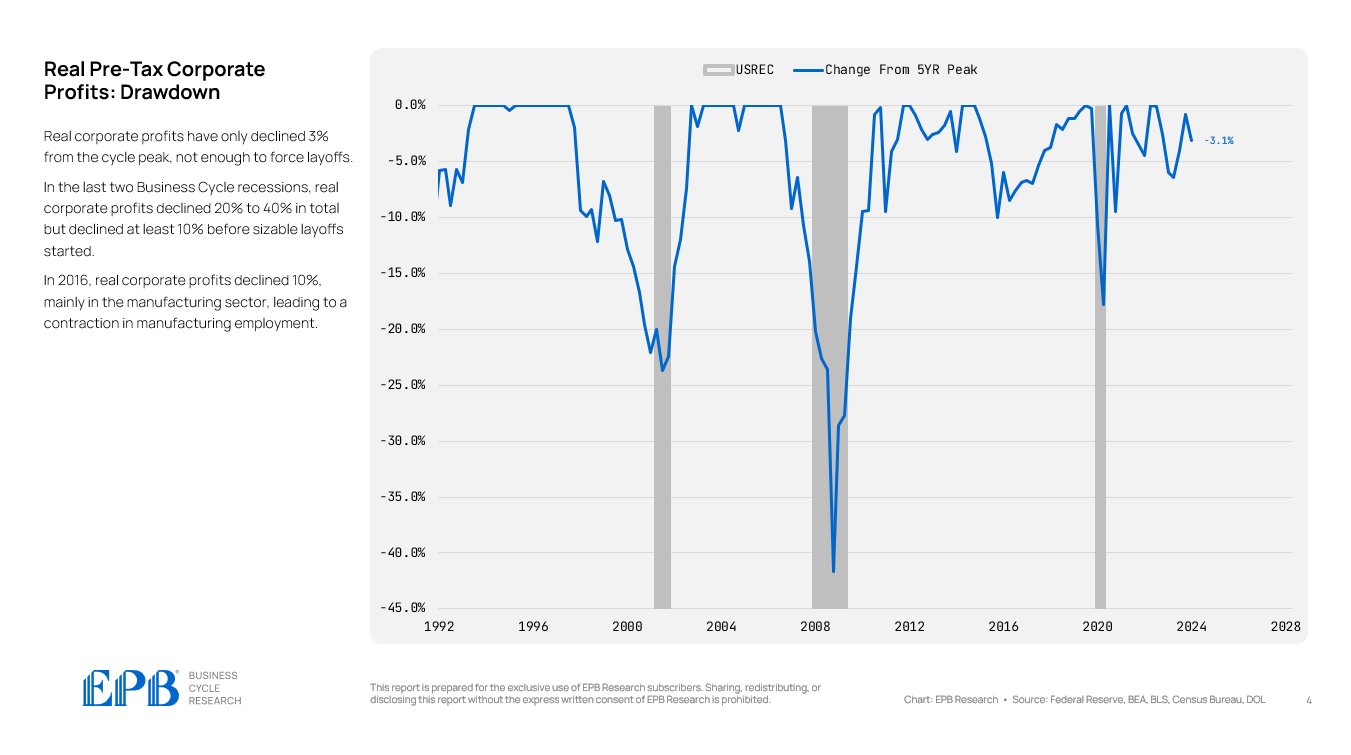
Real corporate profits have only declined 3% from the cycle peak, which is not enough to force layoffs.
In the last two Business Cycle recessions, real corporate profits declined 20% to 40% in total but declined at least 10% before sizable layoffs started.
The chart below confirms the situation in the labor market.
On the left, we show the non-seasonally adjusted path of initial jobless claims, which shows no material layoffs compared to prior non-recessionary years.
On the right, we can see the average pace of job creation which is proxied by an average of nonfarm payrolls and the employment level.
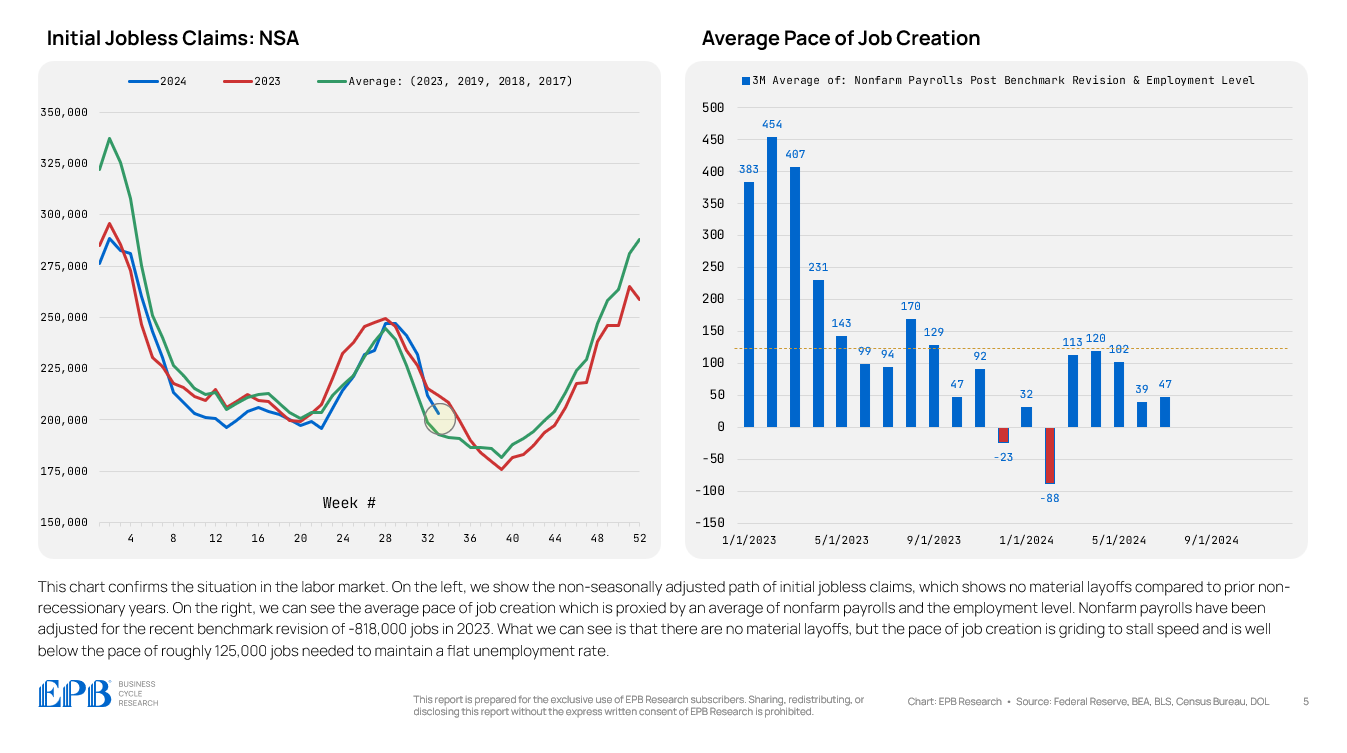
Nonfarm payrolls in the chart above have been adjusted for the recent benchmark revision of -818,000 jobs in 2023.
There have been no material layoffs, but the pace of job creation is stalling and is well below the roughly 125,000 jobs needed to maintain a flat unemployment rate.
These charts, analysis, and more were featured in the EPB Weekly Economic Briefing, Week 34.
Visit our website to learn more about our Business Cycle Framework, our institutional research, and our bespoke consulting services.
All our reports are presented in animated video format, which requires minimal effort to consume, so you can save time and focus on what you do best.
I used the average of nonfarm payolls (establishment survey) and employment level (household survey)
Brilliant article