


Crowding Out The Private Sector
Unchecked government spending growth is smothering the private sector, eroding productivity and blurring the economic picture for policymakers.

The size of the US government has been growing for decades, but that trend accelerated after the major pandemic spending binge. As government spending increases, the less productive public sector absorbs more labor and resources, starving the more productive private sector of these critical inputs.
This year, private sector job creation has slowed dramatically, comparable to periods of near recession, while government job creation remains robust. This growing imbalance is not only undermining long-term productivity but also complicating the Federal Reserve’s ability to read the true strength of the cycle and tailor interest rate policy to the economy as a whole.
Growing Government Size
Economists Andreas Bergh & Magnus Henrekson wrote a critical paper analyzing the evidence behind the relationship between larger government size and worse growth outcomes.
There are several important points behind their conclusion about this relationship.
First is that increasing the size of government is initially beneficial. As the government grows from 5% of GDP to 10% of GDP, the economy gains a net benefit. However, there is a point of diminishing returns where larger government leads to worse growth outcomes. This tipping point is not precise, but the evidence generally clusters around 25%.
The proper way to measure government size is not the deficit but rather total government spending as a % of GDP. This measure captures the amount of dollars the government is directing, as the government tends to direct capital less efficiently than the private sector.
As of Q1 2025, total government spending by federal, state, and local governments was 35.3%, well beyond the estimated 25% tipping point.

To remove some of the cyclical effects of automatic stabilizers and recessionary responses, it’s more appropriate to measure government spending as a percentage of GDP on a rolling 5-year or 10-year basis.
Over the last 5 years, total government spending averaged 37.7% of GDP, up more than 10 percentage points from the 1960 government size.

The most important factor in this analysis is government spending as a % of GDP, but the paper also makes strong reference to the fact that the composition of spending impacts growth outcomes as well.
In short, government investment in education and infrastructure tends to be net positive, whereas government spending on transfer payments, administrative salaries, and operational expenses, such as offices and supplies, is generally net negative.
The current budget breakdown shows that only 11% of government spending is for investment. The vast majority of the budget is transfer payments, interest payments, and consumption expenditures, which include salaries and operational expenses.
Government size in the United States has grown steadily for decades, and the trajectory continues to worsen. Moreover, the composition of spending is not favorable to positive growth outcomes. As the size of government continues to surge further away from the estimated 25% tipping point and moves towards 40% or higher, the crowding out and suffering of the private sector at the expense of the less efficient government sector will become more pronounced.
Crowding Out
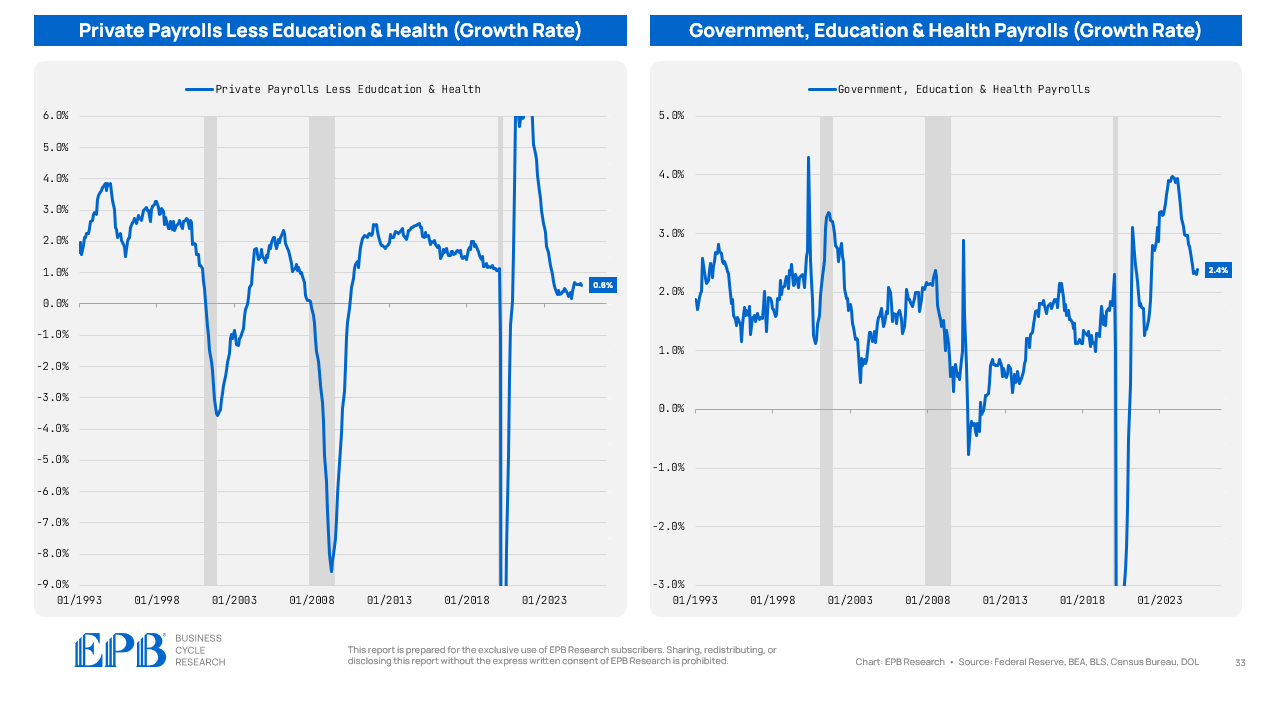
Education and healthcare jobs are generally part of private-sector payrolls, but these are quasi-government sectors as government transfer payments include Medicare and Medicaid, and the government has moved into the student loan business.
So, if we separate the labor market into two buckets…
private payrolls excluding education and health
government plus education and health
…we can see the crowding out in effect.
True private sector payrolls are rising at a 0.6% annualized pace as of the last jobs report, a rate of growth that is virtually unseen during an economic expansion. In contrast, government and quasi-government payrolls are rising at a robust 2.4% pace.
During the bulk of the last economic expansion from 2012-2019, aggregate weekly hours worked in the total private sector averaged 1.9%.
As of June, aggregate hours are only increasing by 0.9% in the private sector.

From the start of the expansion to its end, from 2009 to 2020, inflation-adjusted weekly earnings grew at a fairly steady rate of 0.8%.
The pandemic caused a short-term spike, but the stimulus and resulting inflation was a net negative in the final analysis, as real weekly earnings are 2% lower than the pre-pandemic trendline.

It’s clear that the increasing size of government has disproportionately harmed the more productive private sector labor market. Job growth is a dismal 0.6%, aggregate hours growth is just 0.9%, and real weekly earnings have fallen short of consumers’ expectations for long-run income growth.
Complicating Monetary Policy Decisions
This bifurcated labor market presents challenges for the Federal Reserve, which is responsible for setting monetary policy that supports the economy as a whole.
As government size grows, sectors of the economy linked to the that government spending will be less sensitive to monetary policy.
However, as the productive private sector weakens, it will become more sensitive to interest rates and less vibrant.
Aggregate labor market statistics are not painting a picture for the Fed that would justify material interest rate cuts. However, lower interest rates are needed in many parts of the private sector, residential construction, and manufacturing in particular.
The distortionary effects of crowding out are likely to result in interest rate relief being implemented more slowly for these sectors in need.
Over the long run, as these trends continue unabated, the economy will suffer worse productivity and real growth outcomes.
While these long-term structural trends are essential, our primary focus is to connect the sequence of economic events into a cohesive understanding of current economic conditions, as well as a future Business Cycle outlook, using our Four Economy Framework.
To learn more about our Business Cycle process and Four Economy Framework, you can read our overview blog post below.
The Sequence of the Business Cycle: Overview

Making sense of the economy requires more than just tracking the latest data—it demands a framework for connecting the dots. The good news is that the economy doesn’t move in random spurts—it follows a predictable sequence.
Plus all the contracts that are with government
Defense industry
And satisfying government regulations
2.5 years to get through red tape so can build a house
Are a fascist state now under the Mussolini model