

The Sequence of the Business Cycle: Overview
An in-depth overview of the Business Cycle Sequence and the EPB Four Economy Framework.

Making sense of the economy requires more than just tracking the latest data—it demands a framework for connecting the dots. The good news is that the economy doesn’t move in random spurts—it follows a predictable sequence.
This sequence has remained the same in every Business Cycle, from the inflationary 1970s to the more modern 21st-century recessions. Recognizing that sequence and following its predictable rhythm is critical for understanding where we are today and where the economy may be headed tomorrow.
In the past several blog posts, we reviewed specific data like residential building backlogs, or provided evidence behind the focus on construction and manufacturing. In this post, I'd like to zoom out and provide a 30,000-foot view of our framework and process for tracking the Business Cycle.
Many are familiar with the sine-wave pattern that represents the Business Cycle. This is the common way Business Cycles are illustrated.

This graph is an accurate representation of the Business Cycle, but the flaw is that it lacks nuance. This implies that the entire economy moves together and that all sectors of the economy experience booms and busts at the same time - this is not the case!
This Business Cycle graph above represents the average person or the average business. This is the Aggregate Economy picture.
The reality, however, is that some sectors of the economy always move before the average, and some always move after the average.
At EPB Research, our approach to the Business Cycle is grounded in what we call “The Four Economy Framework.”
This framework organizes the economy into distinct groupings or four separate economies: Leading, Cyclical, Aggregate, and Lagging.

Each bucket or each economy plays a role in shaping the overall economic narrative.
This process isn’t about reacting to the latest headline but rather piecing together signals from these different areas to form a coherent story.
The first focus of The EPB Four Economy Framework is the Leading Economy.
The Leading Economy seeks to measure the availability of money & credit, as well as soft commitments like building permits and manufacturing new orders. The Leading Economy doesn’t measure any growth or employment directly but instead provides foresight into where growth and employment trends are likely to head.
The Cyclical Economy is the first time we measure growth and employment directly, but only for specific sectors of the economy - construction and manufacturing. Construction and manufacturing are by far the most sensitive sectors to changes in monetary policy and together, they act act as the economy's pulse or the economy’s engine.
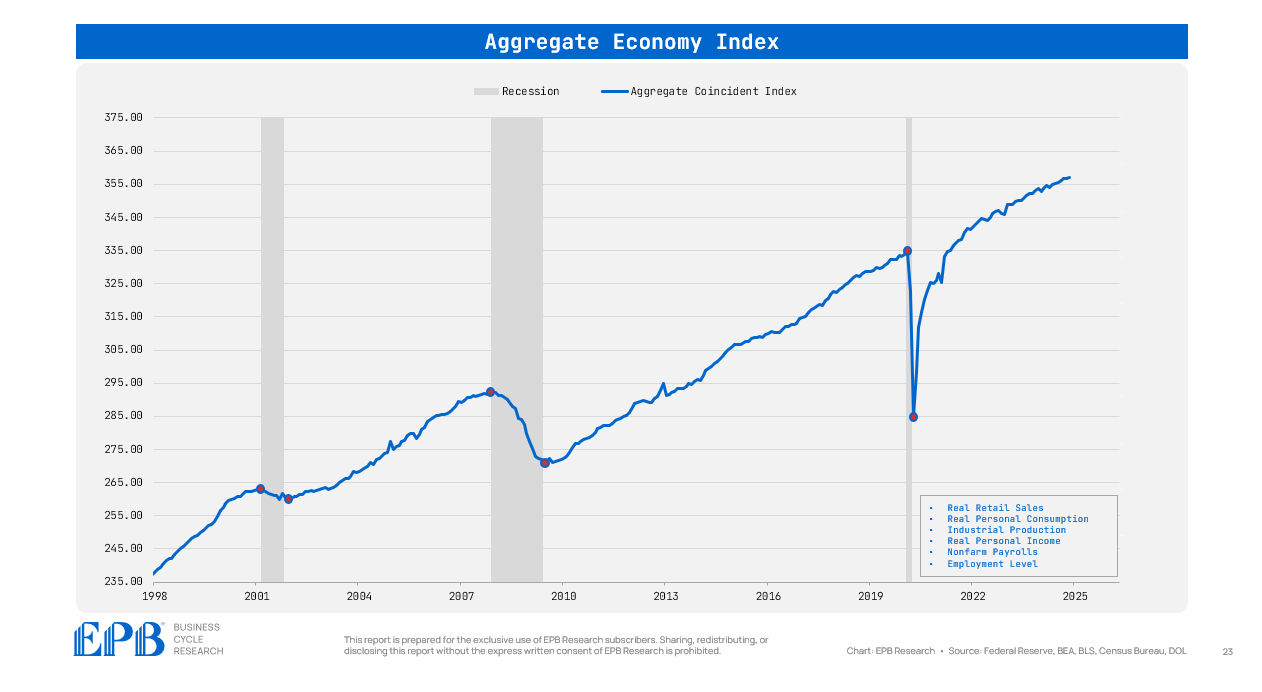
The Aggregate Economy tracks growth and employment for the entire economy - all sectors. In this bucket, we look at total personal consumption, total personal income, and total employment. This measure is the most accurate representation of the overall economy and defines the peaks and troughs in the Business Cycle. Our Aggregate Economy Index uses the same metrics that the National Bureau of Economic Research uses to officially date the Business Cycle.
While the Aggregate Economy is the official measure of how the overall economy is doing, the Leading and Cyclical Economy measures are the more volatile swing factors that determine the future economic momentum.
The Lagging Economy primarily measures growth and employment of the services economy as the services sector is not sensitive to changes in monetary policy.
Generally, the services sector is only impacted once job losses occur in the Cyclical Economy. Once unemployment builds in the earliest sectors, those people who are now unemployed begin to pull back on services consumption, as well as default on auto loans, credit card loans, and other debt. Only then do banks see loan losses increase, leading to a more widespread credit contraction and downstream impacts on the services sectors.
Ultimately, the goal of The EPB Four Economy Framework is to connect the sequence of economic events into a cohesive understanding of current economic conditions as well as a future Business Cycle outlook.
The process isn’t about predicting the exact path of markets or the economy day by day but rather identifying whether conditions favor an overall offensive or defensive stance.
This framework is exactly what we review in our flagship Business Cycle Trends report each month.
By synthesizing these sequential trends, the framework provides a repeatable, consistent, and structured way to approach the economic environment and resulting investment decisions.

While no single indicator tells the full story, creating buckets of indicators that all move at the same time in the overall sequence creates a more robust way to analyze the economy.
Any single indicator is subject to a false signal, but a collective basket of indicators, grouped into a historically consistent sequence, is far more reliable.
In future posts, we'll review each part of this process, step by step, in more detail, such as the data within the Leading Economy bucket or a deeper look at the importance of key sub-sectors in the Cyclical Economy like motor vehicle manufacturing.
Hopefully, this overview was helpful and provided clarity on how we think about tracking the US Business Cycle.
If you found this post interesting, please share it, and don’t forget to enter your email below so you receive the next article in your inbox!
Click the link below to learn more about our Business Cycle Research services.
I expect your subscriptions to go through the roof in H1 2026.
It's good to get these predictions out there ahead of time.
The 18 year real estate cycle is about to get pretty damned ugly later this year into next.
Really excellent work.
Hi Erik, I am always a fan of your great analysis, and I hope your health is ok these days. I verified your assertion that Construction and Manufacturing are good early cycle indicators. I chose 4 Construction ETFs AIRR, ITB, XHB, PKB and 3 Industrials ETFs, PSCI, FXR, XLI that I know have some early indication. I manually weighted them to get the most earliest possible changes with respect to SPY (using 200 day on day growth). When I overlay the two series (the "Early" weighted average and the SPY) I observe since 2005 the comparison shows key regime change points well before the SPY goes negative. Very interesting - you might wnt to try it yourself. - David