How Far Behind The Curve Is The Federal Reserve?
Plotting the change in Federal Reserve interest rate policy before and after a trigger of the Sahm Rule.
With the unemployment rate rising, triggering the popular Sahm rule, it’s become an increasingly consensus view that the Federal Reserve is “behind the curve,” meaning they should have already started to lower interest rates to prevent more labor market weakness.
Most people are well aware of the Sahm rule, a measure of how much the unemployment rate has increased above the lowest level of the last twelve months when using a 3-month smoothed average.
The Sahm rule was triggered in the July Employment Situation Report. Historically, the Sahm rule has been a slightly lagging indicator, meaning the trigger dates occur after a recession has already started.
In this post, we won’t address whether a recession has started or not but rather look at historical changes in the Federal Reserve's interest rate policy around historical Sahm rule trigger dates.
The first chart shows the change in the Fed Funds Rate around Sahm Rule trigger dates.
You can see there is a split in the data.
Rate cuts in modern recessions (2008, 2001, 1990) occur before the trigger date, while rate hikes in 1970s inflationary recessions can occur after the trigger date.
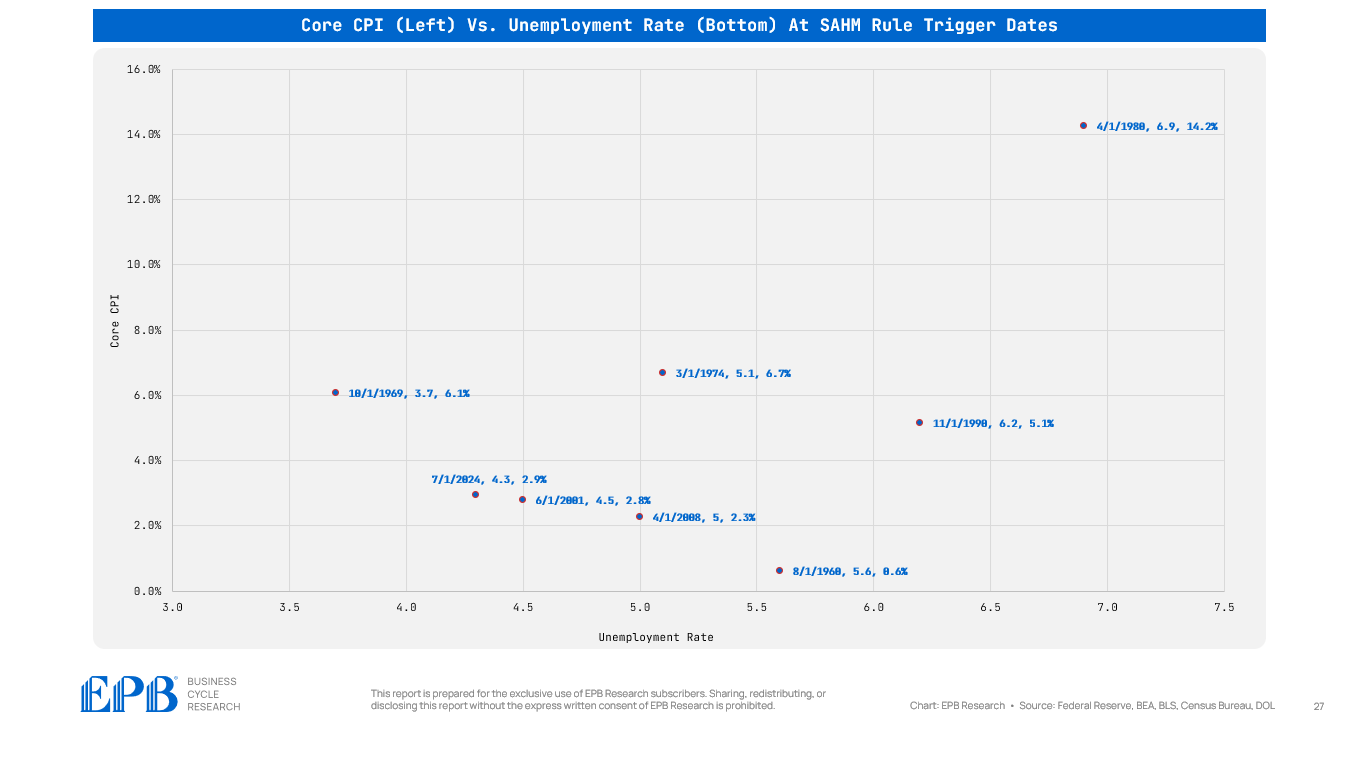
The following chart shows the relationship between Core CPI and the Unemployment Rate at Sahm Rule trigger dates.
All the inflationary recessions (1970, 1974, 1980) had core CPI over 6% when the Sahm rule was triggered.
Today's numbers are tightly clustered with 2001 and 2008, which are more modern numbers, meaning there is no major inflation problem at the Sahm Rule trigger point.
If we follow the more modern, non-inflationary historical path, which I think is appropriate, we can see on the left chart that the Fed is behind the curve.
The right-hand chart shows the path of inflationary recessions.
If we take the average of 2008, 2001, 1990, and 1960, the Fed Funds rate is down about 200bps when the Sahm rule is triggered.
This implies the Fed should have the policy rate at 3.5% today.
The 1970s had a secular inflation problem that required multiple recessions to cure. It remains unclear whether the burst of inflation in 2021 and 2022 was the start of a secular inflationary phenomenon or if it was a giant cyclical burst of inflation within a multi-decade disinflationary trend.
If the latter proves true, the Fed is about 200bps behind the curve.
Now, roughly 200bps of rate cuts are expected over the next year, which would bring the policy rate back into better historical balance.
However, this assumes no significant further increase in the unemployment rate, which is not the message coming from the Leading Indicators of Employment.
If you found this report informative, please share it with anyone you think would find it valuable. It is a great help to us to have our work shared with a broader audience.


I’d argue that “behind the curve” is the Fed’s normal state of being. Such is life driving through the rear-view mirror.