


Let's Talk Layoffs & Jobless Claims
A historical analysis of jobless claims as a leading indicator of recessionary periods.

Over the past year, there has been a steady string of layoff announcements from companies large and small.
Despite the news headlines regarding layoffs and the recent increase in the official unemployment rate, the popular economic indicator of weekly jobless claims has not staged a material rise commensurate with the other employment statistics.
The unemployment rate can rise due to workers losing employment or a lack of new job creation. Currently, the rise in unemployment is coming mostly from a lack of new job creation, which is not uncommon at the start of economic downturns.
As business conditions weaken, companies take several steps to protect profit margins, including reducing hours worked, scaling back capital expenditures, and freezing new hiring. All of these early steps are captured in a well-formed Leading Employment Index.
Layoffs generally occur after these less costly steps are taken.
Historically, initial jobless claims have been considered a leading indicator because the track record shows a history of the measure rising roughly 6-8 months before the onset of a recession.
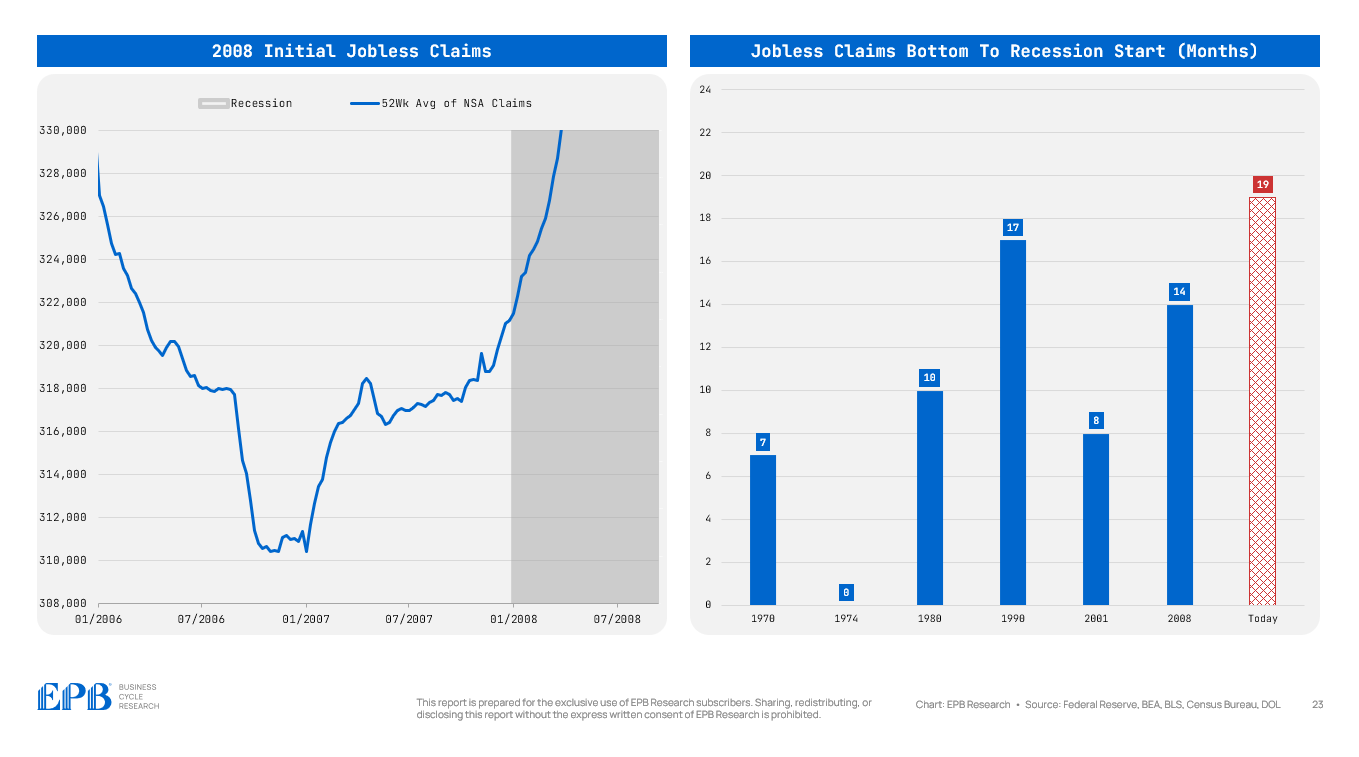
The chart below shows the long-term history of initial jobless claims, graphed non-seasonally adjusted.

Initial jobless claims historically increased several months before the onset of a recession, but like all leading indicators, the lead time is highly variable.
Initial jobless claims failed to have any lead time ahead of the 1974 recession but started to rise 17 months before the 1990 recession.
In the charts below, we’ll zoom in on the trough of each recessionary period.
Jobless claims bottomed roughly 7 months before the 1970 recession.

The 1974 recession was unquie. Jobless claims failed to show any increase but this failure was not about jobless claims as an indicator. Employment, as measured by nonfarm payrolls, did not contract until several months into the start of the recession - an outlier example of a very late employment decline.

Jobless claims led the 1980 recession by roughly 10 months.

The longest lead time occurred before the 1990 recession, with jobless claims starting to rise 17 months in advance.

The 2001 recession had a roughly average lead time of 8 months.

Jobless claims had a funky pattern ahead of the 2008 recession, leading by 14 months.
Jobless claims steadily declined throughout the 2010-2020 period, a business cycle expansion that had several sharp economic slowdowns and near-recessionary periods but never a substantial contraction in the labor market.

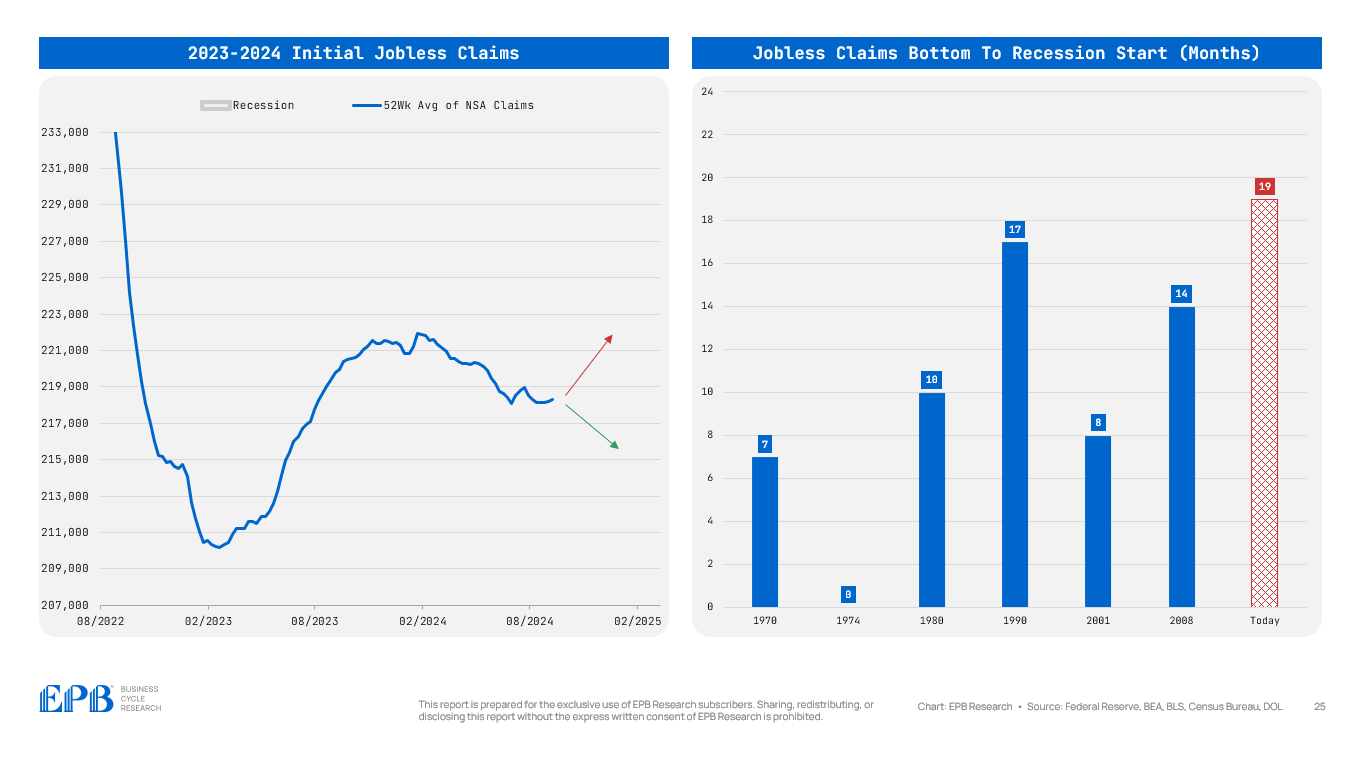
Jobless claims hit a cycle low 19 months ago and have increased mildly. Jobless claims have edged lower since the first quarter of 2024 but are potentially staging another mini-trough.
Jobless claims are a sound economic indicator but subject to the normal rules that go with any leading data point: any leading indicator is subject to false signals, and lead times are highly variable.
This is why using a “basket approach” or measuring an array of economic indicators is always the most effective, as the entire basket is less likely to fail at a turning point.
The outlook on the entire employment situation is not swayed by jobless claims alone, but jobless claims remain an important component of any leading employment basket.
Soft landing situations have occurred when there was an increase in jobless claims and then a return to a new cycle low.

Broadly, the collective basket of leading employment variables is objectively worsening, so the forward outlook on the labor market is overall pessimistic, but the future path of jobless claims will be important to monitor.
In summary, jobless claims are a sound leading indicator of the labor market. Lead times are highly variable, including zero months ahead of the 1974 recession, a recession with very delayed job losses. Jobless claims should be considered within a broader basket of leading employment variables.
If you found this report informative, please share it with anyone you think would find it valuable. It is a great help to us to have our work shared with a broader audience.
Interested in receiving more Business Cycle analysis just like this? Consider our subscribtion research.
Our goal is to help you stay informed and stay ahead of major Business Cycle trends with just a few minutes per month through our animated video presentations.
If you are an institution, corporate management team, or operator of a cyclical business and need help navigating the current Business Cycle environment, please book a call with us so we can learn more about your business and explain how we can best help improve your operation.
Solid. Your attention to detail is inspiring. If you wanted to write about your leading employment index that would be awesome. Your discussion of your coincedent employment index was very nice. The same for leading would be very very nice if that's not too much secret sauce
Great insights!