


US Housing Inventory (Chart Of The Week)
Our featured chart from the EPB Monthly Business Cycle Trends Report for June 2024

The "months supply" figure is the best measure of supply/demand balance for US housing.
A balanced market with no upward or downward national price pressure is roughly 5.5 to 6.0.
The current months supply of new homes is very high, although some of this supply represents homes that are not fully completed.
This level of months supply is leading to price cuts and discounts for newly constructed homes, but it’s not huge - roughly 6% on average.
The reason it’s not huge is because the market is still tight on the existing home side with a months supply of 3.7.
3.7 is the highest level since 2020, so inventory is creeping up in the existing home market.
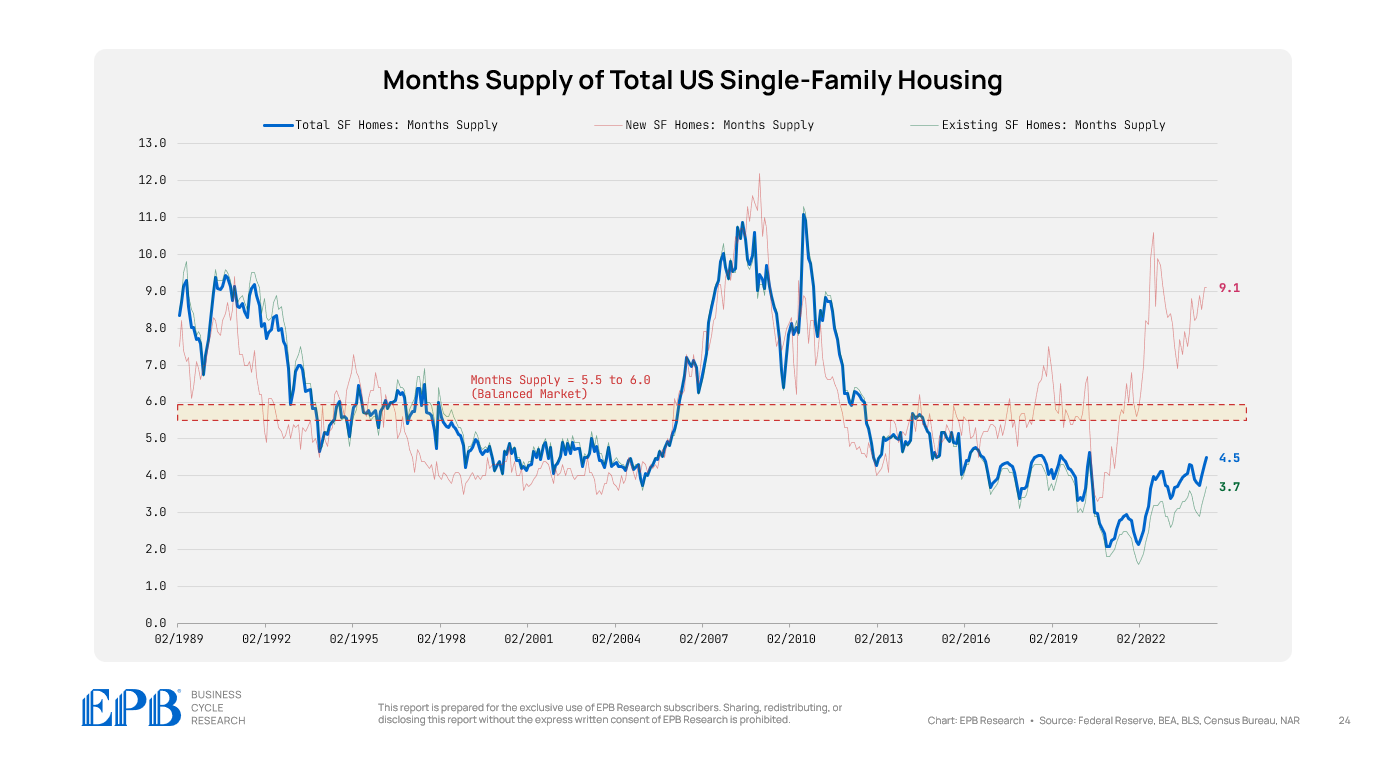
Existing homes account for about 85% of total housing volumes, so if we look at the whole US single-family housing market, we see a months supply of 4.5, which is the highest level since 2020 and higher than the average of 2018 and 2019, which was 4.2.
The national single-family home market has a monthly supply of 4.5, but that means some regions are closer to 6.0, and some are still tight, down at 3.0.
In other words, price pressure is starting to appear, but only in regional markets.
As the total months supply continues to rise, price pressure will intensify and broaden, forcing builders to clear inventory at deeper discounts. This will impact profit margins and increase the probability of layoffs that the residential construction sector has been able to delay.
This chart was featured in the EPB Monthly Business Cycle Trends Report for June 2024.
If you are looking for more research, consider our subscription services.
All our reports are in animated video format, which requires minimal effort to consume, so you can save time and focus on what you do best.
Can you point me to the scientific “why” regarding the 6-month benchmark? I’ve looked before and all I can find is “because NAR says so” or “because it is widely accepted”.
In any case I am not convinced that it is the true “balanced market” metric. Using the data series for my MSA at (https://trerc.tamu.edu/data/housing-activity/?data-MSA=Austin-Round+Rock-San+Marcos) the average Months Inventory for every month since 1990 is 3.9 and the Median is 3.85.
I have no clue how this compares to other markets. Frankly I am not a huge fan of aggregating data like real estate that is so region dependent.
In any case, let’s call the Austin benchmark 4-months of supply. We only just crossed north of that in April of this year.
From the front lines I can tell you that yes, SF housing is under pressure. But unless you are high income and can handle a 7 handle mortgage (or are a cash buyer), it is also not exactly a “buyer’s market” either. This very strange interest rate environment has shrunk the pool of both buyers and sellers to create a very constrained market on both sides of a transaction. The only real question is, how long can this last? Also, are labor market fundamentals strong enough, long enough to outlast the Fed’s interest rate/ federal deficit problem?
Really find these articles interesting Eric