


How to Improve Building Permits as a Leading Indicator
Learn how a sequential Business Cycle process can turn building permits into one of the most reliable early warning signals for the economy.

New residential building permits are one of the best leading indicators of recessions.
With a sequential Business Cycle process, as we’ve outlined in our last several posts, you can make them even better.
Building permits are a powerful early warning tool because they mark one of the first steps in the residential construction process. Residential construction plays a critical role in the Business Cycle.
If you can get an early lead on changes in residential construction, you can anticipate broader economic shifts before they happen. When building permits decline sharply, it signals an upcoming fall in construction activity — and eventually, a decline in residential construction employment.

Since 1962, building permits have declined more than 10% from their 24-month peak 340 times. In those cases, about 44% of the time, a recession was either already underway or occurred within the following 18 months.
(It's important to note: housing-related cycles can have long lead times.)

The problem is that building permits are volatile, and we don't want random noise.
The Business Cycle is a sequential process. What we really want to capture are declines in building permits that happen as a result of monetary tightening, not just random fluctuations.
We can make the signal much more powerful by filtering the data. The first improvement is to require that a 10% decline in permits occurs within 24 months of a yield curve inversion. This filter alone reduces the number of signals from 340 to 180, and 75% of these filtered signals correctly forecasted a recession ongoing or within 18 months.

An even tighter criteria is to require that permits are actively declining — adding a negative momentum filter.
This further reduces occurrences to 135, and 83% of the time, a recession was active or occurred within the next 18 months.

Finally, clustering the signals eliminates noise even further. When multiple signals occur within 12 months of each other, only the first signal in the cluster is used.
For example, you can see in the 2007 decline a series of consecutive signals. Clustering leaves us with only the first signal in the group.
When clustered, the only false pocket was in 1967.
All other clusters were successful, with an average lead time of 10.5 months.
This matters because the yield curve alone (using the 10-year Treasury minus the Fed Funds Rate) has many false signals, and an average lead time of nearly two years.
By layering the sequence…
yield curve inverts → permits decline → permits continue declining
…you dramatically improve the timeliness and accuracy of the signal.
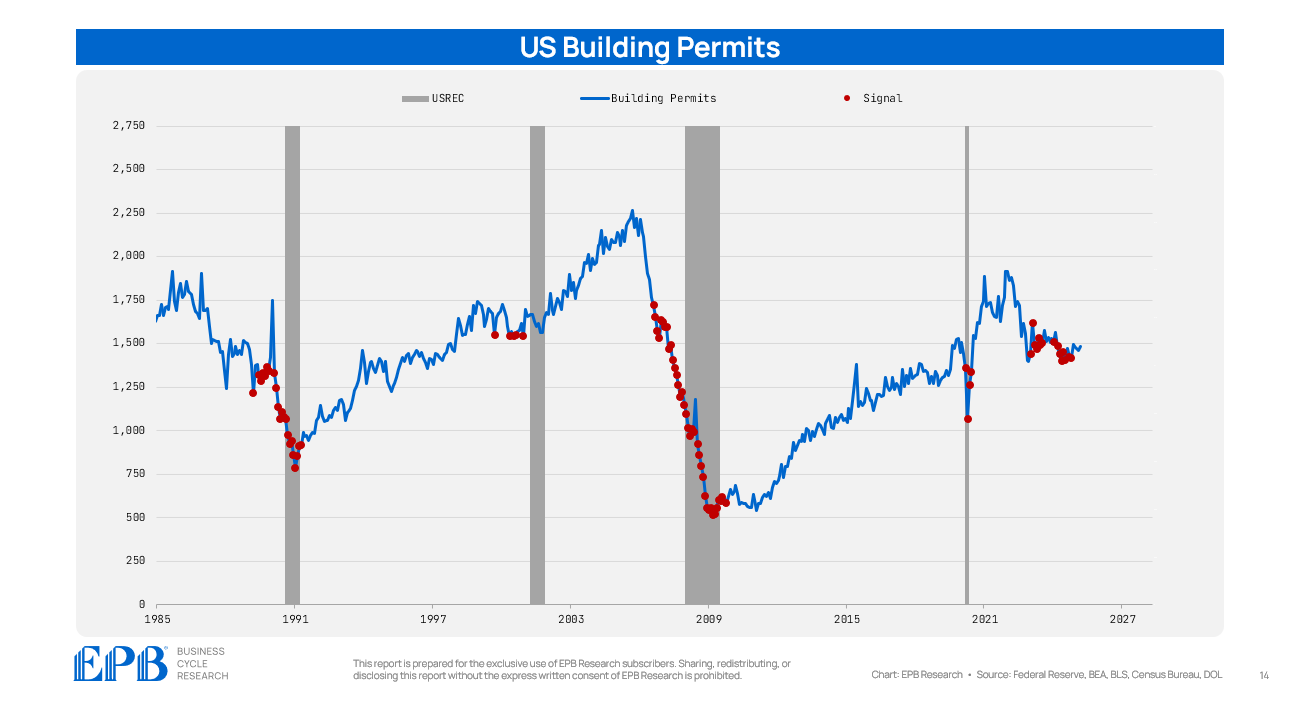
Today, the economy recently rolled off one of these clustered signal pockets.
However, building permits have stabilized for now, as the current level of building permits is above the 12-month and 18-month averages.
This stabilization is one of the most critical Business Cycle dynamics currently, before the potential trade war disruptions.
This is just one example of how confirming sequential signals can deepen your understanding of cycle dynamics.
Even using just two variables — the yield curve and permits — shows how thinking about the economy as a sequence, not as isolated events, can improve your timing and your decisions.
Layering additional variables makes the signal even more powerful.
At EPB Research, we build these sequential, model-driven insights across the entire economy — housing, manufacturing, labor markets, inflation, and monetary policy — to help investors, executives, and corporate managers stay ahead of the Business Cycle.
If you want to learn more about how we do it — and how you can apply it to your own business and investment decisions — you can become a member here:
If you found this post interesting, share it, and leave your email below so you don’t miss the next post in your inbox.