


Understanding the Leading Economy: The First Step in Tracking the Business Cycle
Tracking the Leading Economy reveals early signals of economic turning points by analyzing money, credit, and forward-looking business commitments.

In our last blog post, we explored the broader framework that underpins our process for tracking the Business Cycle - the EPB Four Economy Framework.
(Click here to read the previous post)
In that overview, we established that while the Aggregate Economy represents the overall economic picture and “defines” the Business Cycle, different sectors move at different times.
Some sectors always lead the broader economy, and some sectors always lag.
The good news is that the sequence is the same in every Business Cycle. Understanding this sequence is, therefore, crucial in making sense of where the economy stands today and where we might be headed next.

It’s a repeatable, step-by-step process. If you know you are in the second step of the process, you can pay particular attention to step three. This allows for a crystal clear focus and massively helps to reduce noise, confusion, and conflicting opinions.
The last post was an overview of the entire process.
In this post, we’ll focus specifically on the first step, tracking the Leading Economy.
The Leading Economy: The First Glimpse Into The Future
In the EPB Four Economy Framework, the most critical part of the last three buckets is the labor market. The labor market is the ultimate driver of the economy.
The Leading Economy is the origin of the Business Cycle sequence.
The Leading Economy doesn't measure growth or employment directly but rather the conditions that determine the future path of growth and employment.
These indicators offer an early warning system, providing valuable insight into whether economic momentum is likely to strengthen or weaken in the coming months.
The Leading Economy measures the availability of money & credit, as well as forward-looking business commitments and sales of key Cyclical Economy items.
Let’s look at a few specific Leading Economy items, starting with the most leading, real money supply.
At EPB Research, in our weekly publications, we track several measures of money supply as there are different monetary aggregates that provide different information.
Below, we are looking at the inflation-adjusted Austrian measure of money supply called TMS-2. This is a broad monetary aggregate that removes some items that cannot be instantly converted to cash, like bank CDs and money market funds. These instruments must be converted into a checking account before being spent.
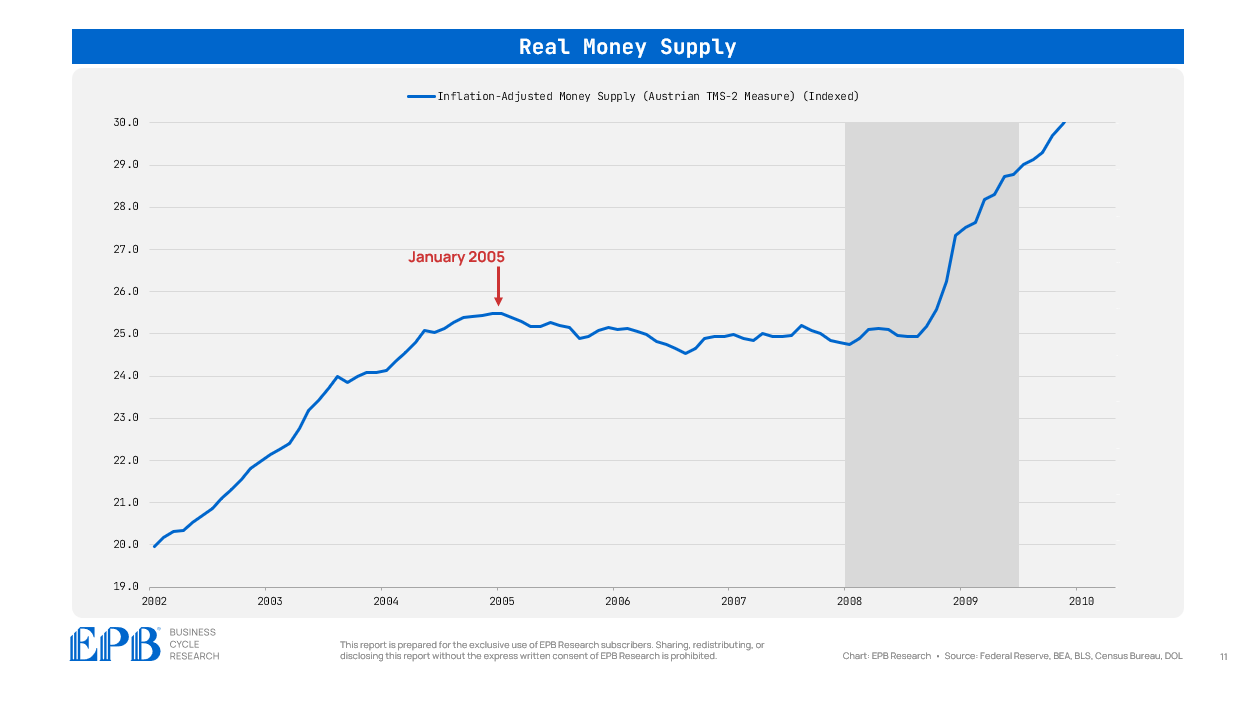
The Federal Reserve started to raise interest rates in the summer of 2004. The increase in interest rates slowed the rate of real money creation - which is the goal.
Real money supply peaked in January 2005 and trended flat-to-down through 2008. The economy requires increasing real money supply to grow the unit volume of production and consumption, so this flattening and decline in real money supply created tight conditions.
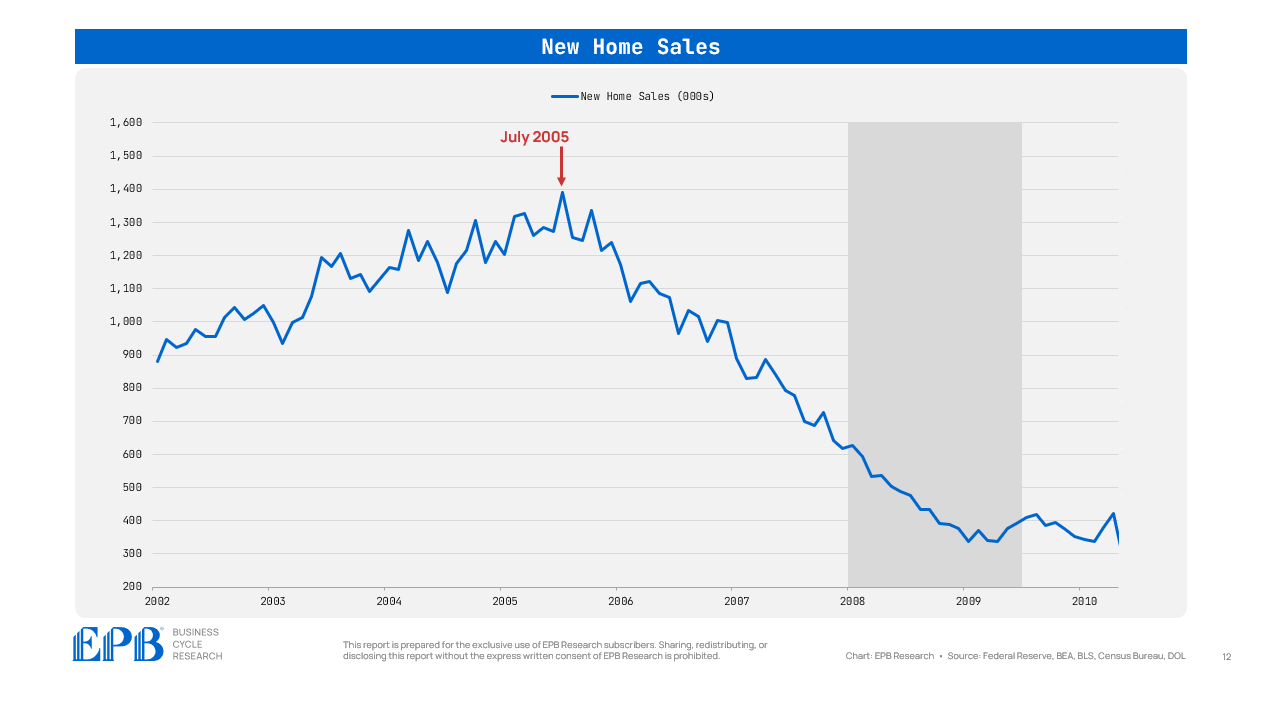
Shortly after the peak in real money supply came a peak in another Leading Economy indicator - new home sales.
New home sales peaked in the summer of 2005 and headed down sharply through 2008.
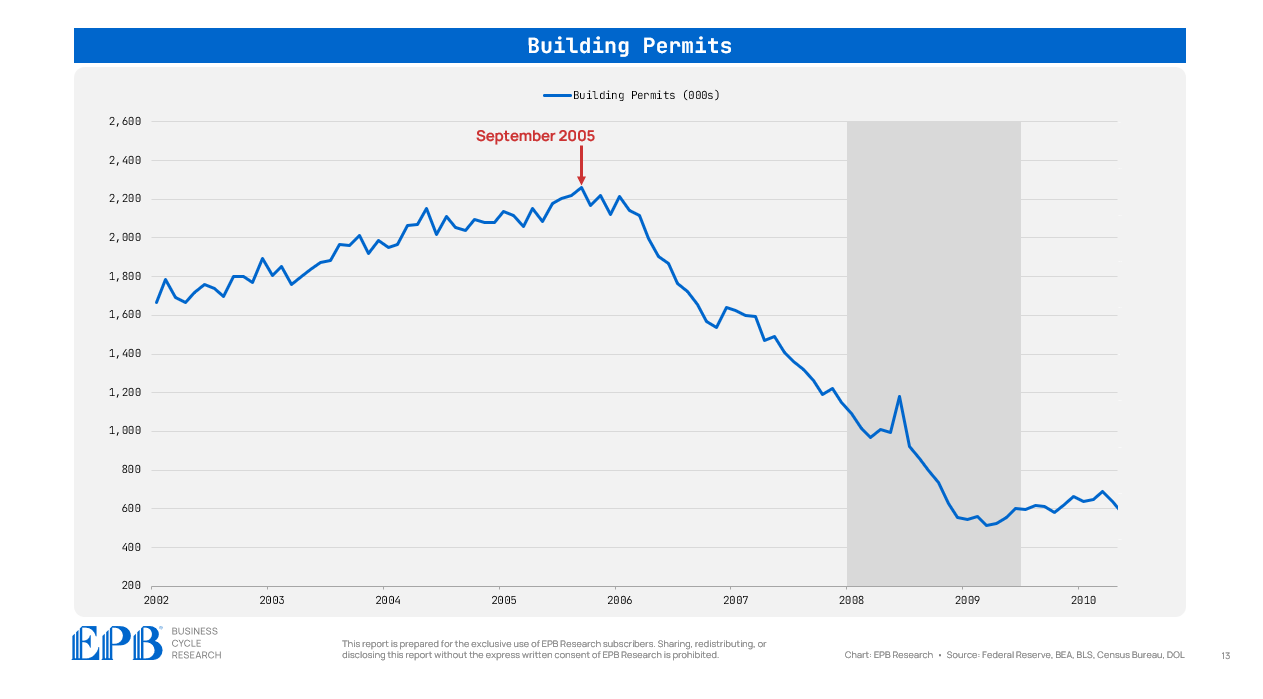
Similarly, applications for new building permits peaked in September 2005 and headed down forcefully throughout 2006 and 2007.
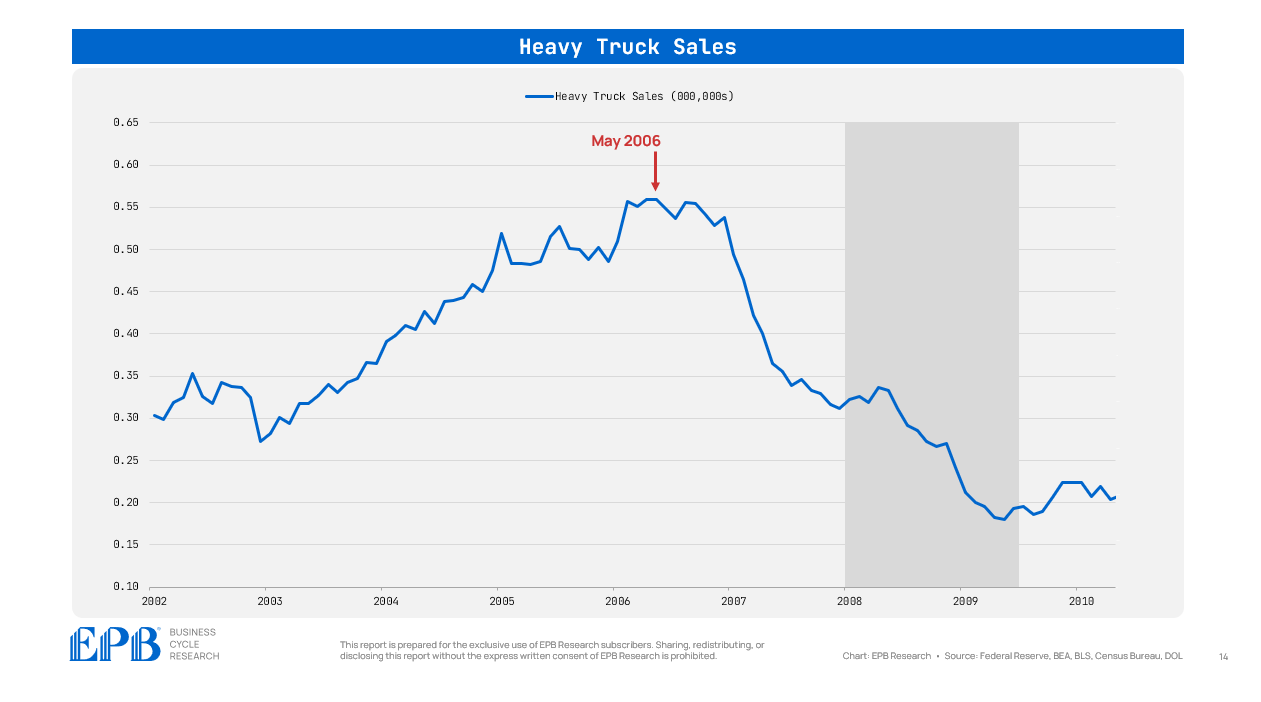
While housing was at the center of the 2008 Business Cycle, new heavy truck sales, a key indicator of future motor vehicle manufacturing, peaked in early 2006 and declined through 2007 and 2008.
The yield curve also inverted in early 2006 and stayed inverted throughout 2007.
Putting it all together, by early 2006, two years before the onset of the Aggregate Economy recession, there was a peak in real money supply, an inversion of the yield curve, a peak in new home sales, building permits, and heavy truck sales.
While this is not an exhaustive list of Leading Economy indicators, it clearly demonstrates the benefits of the Four Economy Framework and why grouping indicators that are all supposed to move at the same time is powerful.
A “cluster” of peaks and subsequent declines in a collective group of indicators that are all Leading in nature highlights that monetary policy is tight and declines in employment are likely coming.
This is how to measure whether monetary policy is “tight” or “easy,” not the stock market as it is commonly used today.
By the middle of 2006, the tightness of monetary policy was abundantly clear yet the stock market soared for more than another year, highlighting why stocks are not a leading indicator in the modern era.
The key point is that these indicators do not measure actual production or employment. However, they always move ahead of the key economic turning points, making them powerful tools for anticipating changes before they show up in broader economic data.
Why the Leading Economy Matters
The Leading Economy or Leading Indicators are not “magic” or voodoo. Many people mistake that Leading Indicators can sometimes work and sometimes fail.
The nature of Leading Indicators is far more mechanical.
While it’s true that the lag time from when Leading Indicators impact actual employment can vary, making changes seem like a random event, it’s genuinely much more scientific.
Lead and lag times are, as the saying goes, sometimes long and variable, but the sequence is mechanical and highly repeatable.
When monetary conditions tighten and are matched with a decline in forward-looking indicators like building permits and the volume of new home sales, it’s a strong signal that economic momentum is set to slow.
Conversely, when money and credit expand and forward indicators like new orders rise, future production and employment tend to follow.
This phase of the cycle is often misunderstood because it does not yet reflect the conditions that people experience in their day-to-day lives.
If the Leading Economy is weakening, the labor market may still appear strong, and the Aggregate Economy may still be growing.
However, waiting until economic weakness becomes visible in the Aggregate Economy often means reacting too late. By then, the major shifts in investment conditions have already taken place.
The First Phase Transition: Leading to Cyclical
The Leading Economy sets the stage for what comes next. If Leading Economy indicators start to roll over, the Cyclical Economy—the next phase of our framework, will likely weaken in the future.
This sequence is why tracking the Business Cycle in a structured and repeatable manner is so critical.
By focusing on the Leading Economy first, we can position ourselves ahead of economic shifts, ensuring that we are prepared for changes in business conditions and investment opportunities before they become obvious to the consensus.
In the next post, we’ll examine the Cyclical Economy in more detail, breaking down why construction and manufacturing serve as the economy’s pulse and drive all the downstream effects in the more popular services economy.
If you’re interested in a structured, repeatable process for tracking the Business Cycle, we cover these trends in detail each month in our flagship Business Cycle Trends Report at EPB Research.
Stay tuned as we continue our step-by-step breakdown of the Four Economy Framework.
If you found this post interesting, please share it, and don’t forget to enter your email below so you receive the next article in your inbox!
Click the link below to learn more about our Business Cycle Research services.
Great article man.
It’s wild how the stock market, often seen as a leading indicator, lagged behind the real indicators.. Makes you wonder, how many people today are looking at the wrong metrics while history quietly repeats itself?
There was a podcast by an australian academic saying its inflation driving the growth of money supply (was this the real money supply you are saying here) and not money supply driving inflation?