


Where Does the US Economy Stand Today?
A data-driven analysis cutting through the noise to reveal the current state of the Aggregate Economy.

Understanding the current position of the economy is a critical first step for any informed business or investment decision.
However, with the release of so much economic data and news every week, it’s challenging to make sense of it all without a structured process for filtering and sequencing the information.
At EPB Research, we utilize a “Four Economy Framework” to understand exactly where the economy stands today and where it is heading tomorrow by categorizing and sequencing incoming economic data into four buckets based on the order in which they move in the business cycle.
You can read an overview of the EPB Four Economy Framework by clicking here.

The reason for breaking the economy into buckets or a sequence is that not every sector of the economy moves at the same time. For example, in early 2007, the residential construction sector was in a deep recession, while the Aggregate Economy was growing at over 2%.
In this post, we will analyze exactly where the Aggregate Economy stands today.
The Aggregate Economy does not reveal anything about where the economy is heading tomorrow; for this, a detailed analysis of the Leading and Cyclical Economy variables is required, which we cover in depth in our flagship Business Cycle Trends Report each month.
The Aggregate Economy
Before we can pinpoint the strength of the Aggregate Economy, we first need to define what we are measuring.
A business cycle, or economic spiral, is defined by the interaction between income, consumption, production, and employment. It is critical to measure all sides of the economic spiral - you cannot just measure consumption or income because a virtuous or vicious economic spiral feeds on itself and becomes self-reinforcing.
The National Bureau of Economic Research, in its Business Cycle Dating Handbook, informs us that six monthly indicators are used to define recessions and expansions, and a change in the business cycle must be evident across all variables, not just one or two.
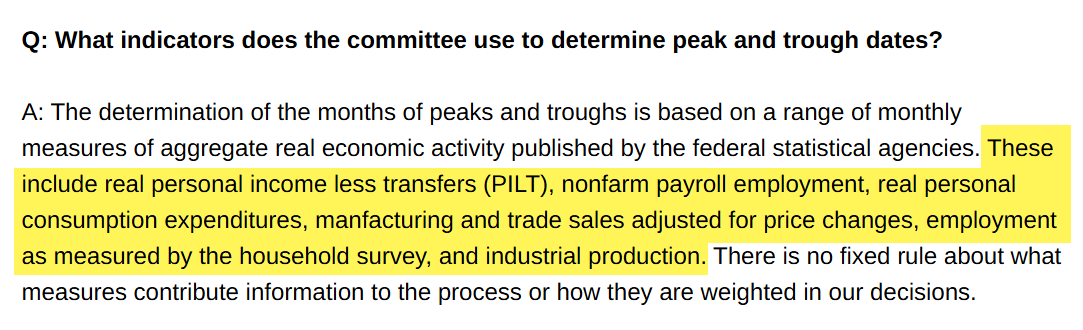
At EPB Research, we aggregate the six monthly variables used by the NBER to create our Aggregate Economy Index, and the peaks and troughs can be seen to line up with recession start and end dates.
Importantly, as mentioned above, peaks and troughs are only recognized in hindsight. This is why the Aggregate Economy doesn’t provide forward-looking information, but rather defines the economy as it stands today. For the forward-looking information, the Leading and Cyclical Economy variables must be used.
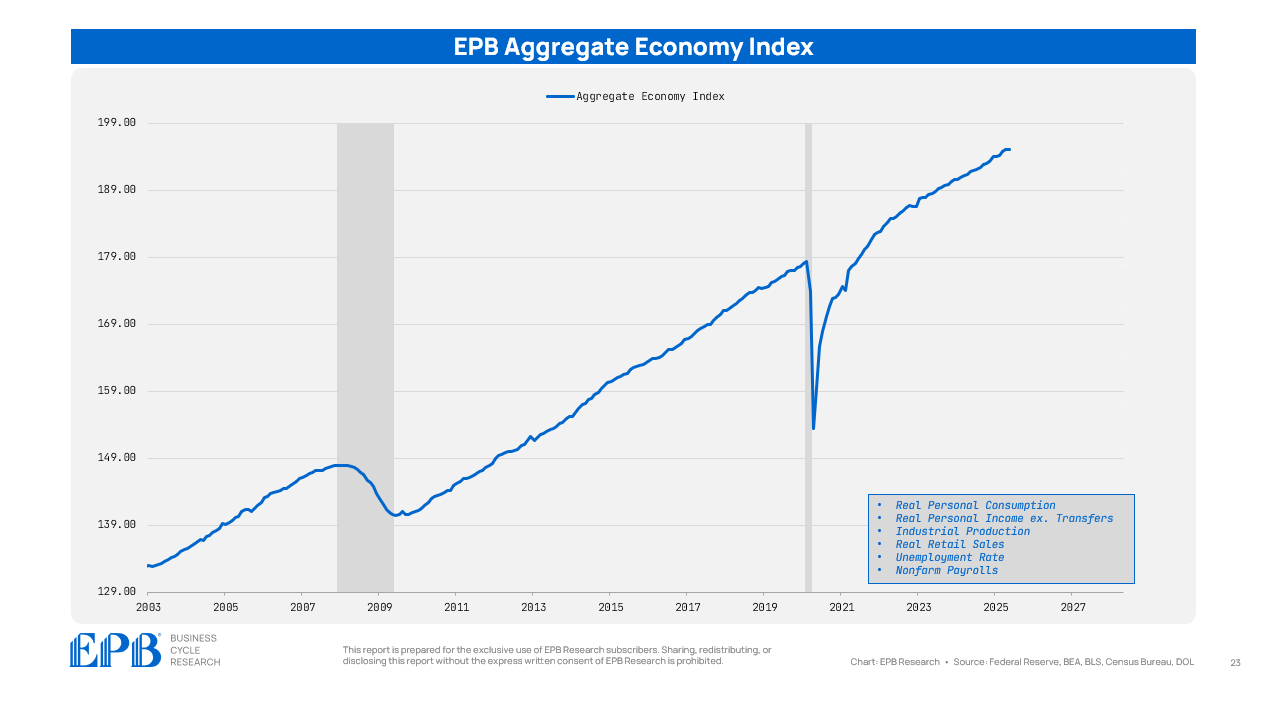
We present the Aggregate Economy in index form, shown above, but we can also analyze the trending growth rate of the Aggregate Economy, which is more important.
We combine the six monthly NBER variables and set the trend to a 2% growth rate, allowing us to have the most three-dimensional and accurate view of how the Aggregate Economy is performing today, answering questions such as:
What’s the growth rate of the economy today?
Is the growth rate increasing or decreasing?
Is the economy growing above or below trend?
We can see that the economy is growing at 1.8% as of the May economic data, a growth rate that is slightly below trend, with a remarkably stable growth rate over the past two years.
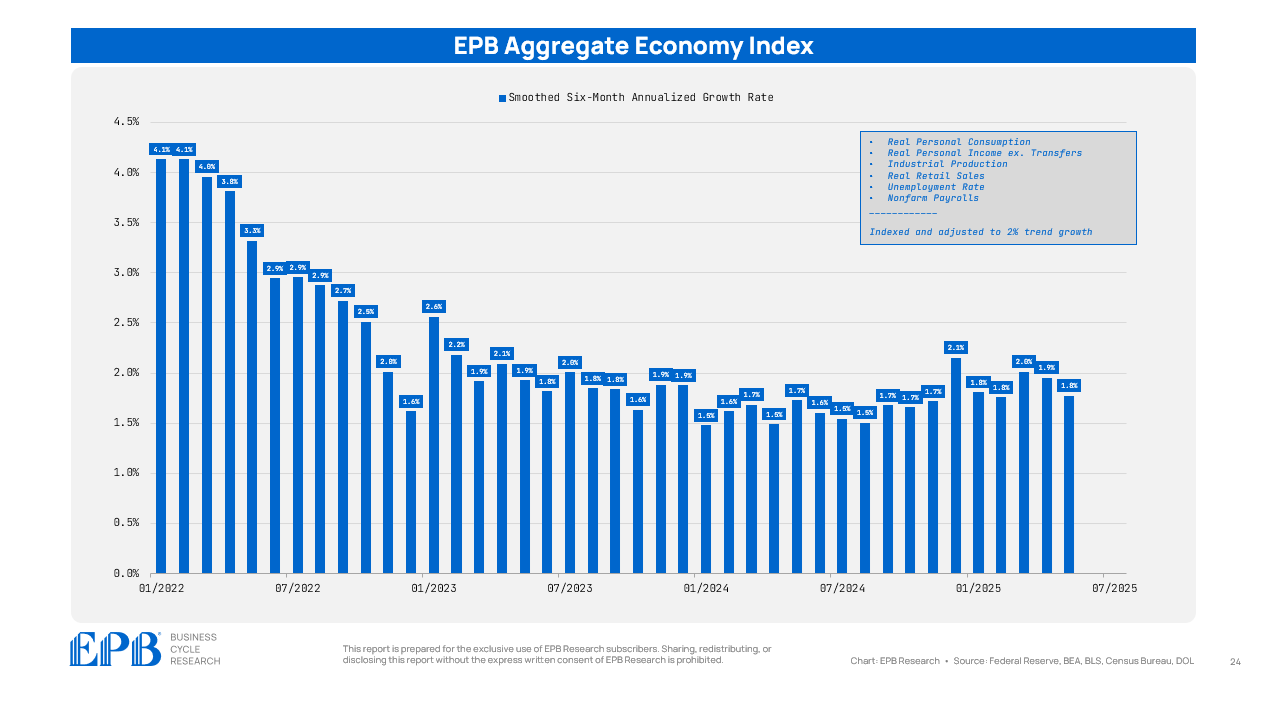
It cannot be emphasized enough that the current growth rate of the Aggregate Economy is not a reliable indicator for making forward-looking decisions, as the growth rate can appear “healthy” very close to recessionary periods, depending on the momentum in the Leading and Cyclical Economy variables.
For example, in the 2008 cycle, the Aggregate Economy was growing at 1.1% when the recession officially began, but was growing at 1.7% in the summer of 2007—a growth rate very similar to today.
In addition to examining how the Aggregate Economy Index is performing as a composite, we can also analyze its individual components, which provide more detailed insights and highlight the unusual nature of the current business cycle.
The Unusual Aspects of this Cycle
The reason the NBER uses the six variables that we aggregate into our composite index is that they have a long history of “clustering” or peaking at roughly the same time. It’s not exact, but peaks and troughs of the six major variables are often in the same ballpark.
If we use the 2008 cycle as a reference, we can see that all six variables peaked (marked by a black diamond) within 12 months of each other, but most within 3-4 months of each other.
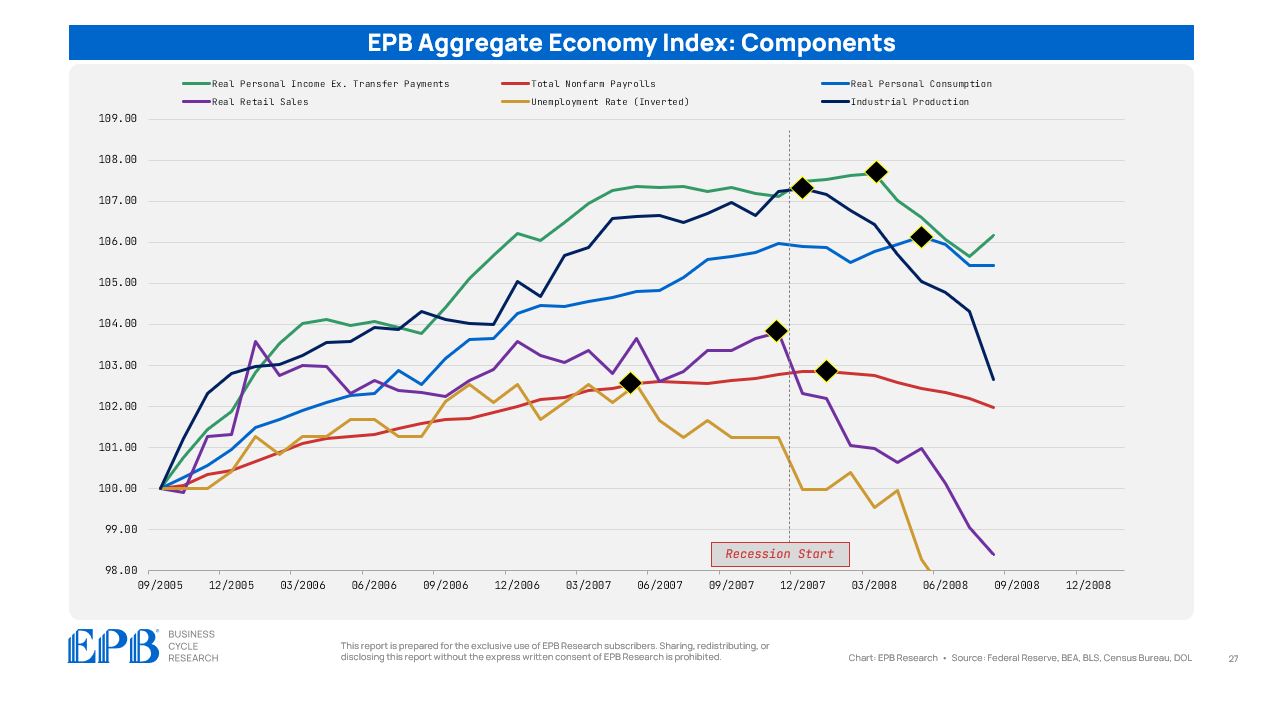
The unemployment rate (inverted) peaked first, followed by real retail sales, industrial production, nonfarm payrolls, real personal consumption, and then real personal income.
At the risk of being overly repetitive, it’s important to remember that these late 2007/early 2008 peaks were preceded by a stunning collapse in Cyclical Economy variables throughout 2006 and 2007.
Today is a bit unusual in that three variables are currently at a cycle peak, while three variables have already reached a cycle peak. Even more unusual is that the clustering has been disrupted in the sense that real retail sales peaked in 2022, while the unemployment rate (inverted) peaked in 2023.
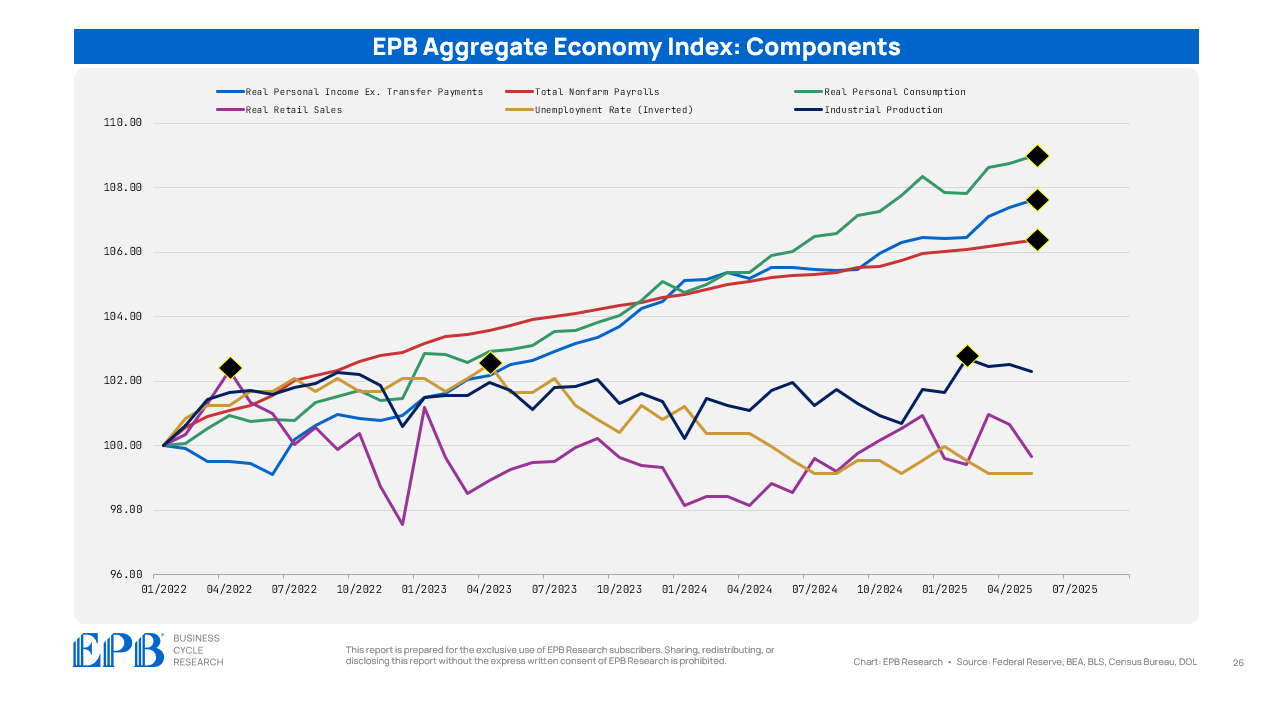
In any case, the individual variable analysis can offer interesting insights, but this is precisely why picking and choosing variables to use is far more dangerous than analyzing the entire basket as a collective.
Where Do We Stand?
To answer the question directly, the US economy is growing at a rate of roughly 1.8% as of the latest data. This is down slightly over the last few months and slightly below the “trend” growth of 2%, but over the last two years, growth has been remarkably stable.

Weaknesses in real retail sales, industrial production, and the unemployment rate are offset by strengths in nonfarm payrolls, real personal consumption, and real personal income. It’s worth noting that the weaker three variables were also the variables that weakened first in the 2008 cycle.
Knowing the economy's current position is the critical first step for any informed business or investment decision.
But truly understanding where the economy is headed requires looking beyond the Aggregate Economy data. That's why we developed and present information in our Four Economy Framework.
This sequential system enables us to track and interpret all incoming data, revealing a more comprehensive and forward-looking picture of the business cycle.
To learn more about our premium research and consulting services, click the button below.
Enter your email below to be alerted when the next article is published!
I didn’t see it but are these numbers including government spending as part of the GDP microcosm ? If so why and if not, why?