


Motor Vehicle Manufacturing: The Key "Driver" of the Cyclical Economy
Analyzing the impact of motor vehicle & parts manufacturing on the Cyclical Economy.

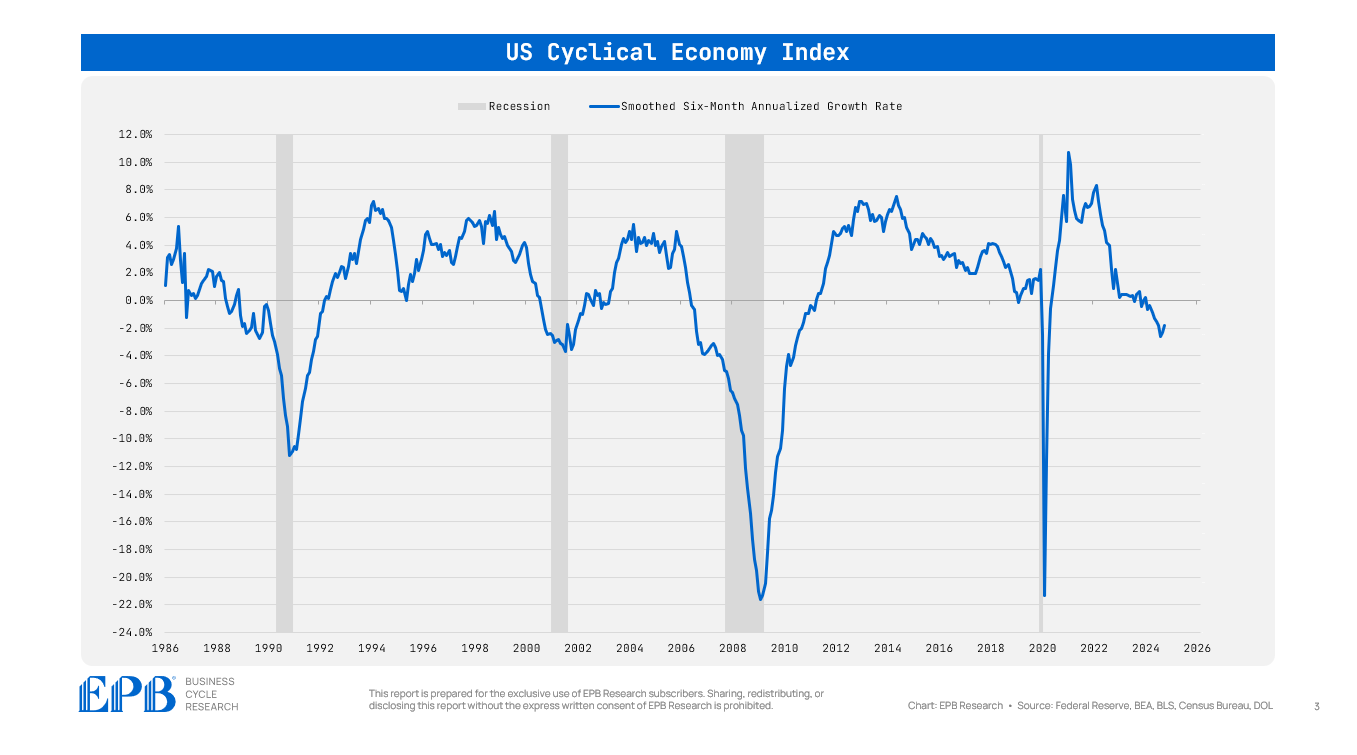
In the EPB Four Economy Framework, the Cyclical Economy is the engine of growth and the driving force behind all booms and busts in the economy.
In our previous three posts, we outlined the Four Economy Framework, discussed the Leading Economy, and highlighted the importance of the Cyclical Economy.

The Leading Economy gives us an early warning sign of future changes in growth and employment by tracking various measures such as real money supply growth, the yield curve, and new home sales.
The Cyclical Economy is the first time we measure growth and employment directly, but only for the construction and manufacturing sectors, as these two industries are the most sensitive to changes in monetary policy and have the largest booms and busts.
The Cyclical Economy is the engine of growth or the pulse of the economy. The rise and fall of construction and manufacturing determine the strength of economic cycles.
The entire Business Cycle rests on the trends in construction and manufacturing.
The Cyclical Economy is the most important component of the Four Economy framework, and further breakdown into the granular sub-sectors of construction and manufacturing is essential.
In this post, we’ll dive into the manufacturing sector and uncover what narrow subsectors are the biggest drivers of the booms and busts within manufacturing and, thus, the overall economy.
Durable Goods vs. Non-Durable Goods
The manufacturing sector has been shrinking in absolute terms and as a percentage of the overall US economy.
However, despite that shrinking size, the swings in the manufacturing sector are so large that it still is a primary driver of the booms and busts in the overall economy.
The chart below is one of many Coincident Indexes we create and track at EPB Research.
The US Manufacturing Coincident Index tracks production output and employment in the overall manufacturing sector.

From early 2000 to 2003, the US Manufacturing Coincident Index declined 12%.
From 2008 to 2009, the US Manufacturing Coincident Index declined 18%.
The Coincident Index for the Aggregate US economy declines roughly 2% in an average recession and 4% to 6% in a deep recession.
The Manufacturing Coincident Index swings nearly 20%!
This clearly demonstrates why swings in the manufacturing sector are still extremely important to the overall economy.
The manufacturing sector is divided into two parts: non-durable goods and durable goods.
Non-durable goods include the manufacturing of food, paper, apparel, tobacco, and more.
Items like food are not highly cyclical, and most of these items are not purchased on credit and, thus, are less sensitive to direct changes in monetary policy.
At EPB Research, we do not focus heavily on the non-durable manufacturing sector of manufacturing.
The chart below shows the US Non-Durable Manufacturing Coincident Index.

Durable goods manufacturing includes motor vehicles, machinery, appliances and other large ticket items. Most of these items are purchased on credit and are heavily influenced by changes in monetary policy.
The chart below shows the US Durable Manufacturing Coincident Index.

The big swings in the overall manufacturing sector are driven by durable goods rather than non-durable goods.
The US Durable Manufacturing Coincident Index declined 15% in the 2001 recession and more than 20% in the 2008 recession.
There was a mini-dip in the 2016 period, with the index declining 2% and again in 2019 before the pandemic, declining another 2%. These mini-dips in the durable goods manufacturing sector created soft patches in the economy and prompted monetary easing from the Federal Reserve.
Today, the durable goods sector is falling, down roughly 2%, coinciding with another period of monetary easing.
Within manufacturing, it’s the durable goods that drive the big cycles.
Motor Vehicles: The Key Driver
The most important category within durable manufacturing is motor vehicles and parts.
The chart below shows our Motor Vehicle and Parts Coincident Index.

In the 2001 recession, the total manufacturing index fell 12%, the durable manufacturing index dropped 15%, and motor vehicle manufacturing fell nearly 15%.
In the 2008 recession, the total manufacturing index fell 18%, the durables index fell more than 20%, and the motor vehicle index plunged over 40%!
The chart below shows the relative performance between the motor vehicle index and the durable goods index.
In other words, it shows whether the motor vehicle industry is dragging manufacturing up or pushing manufacturing lower.
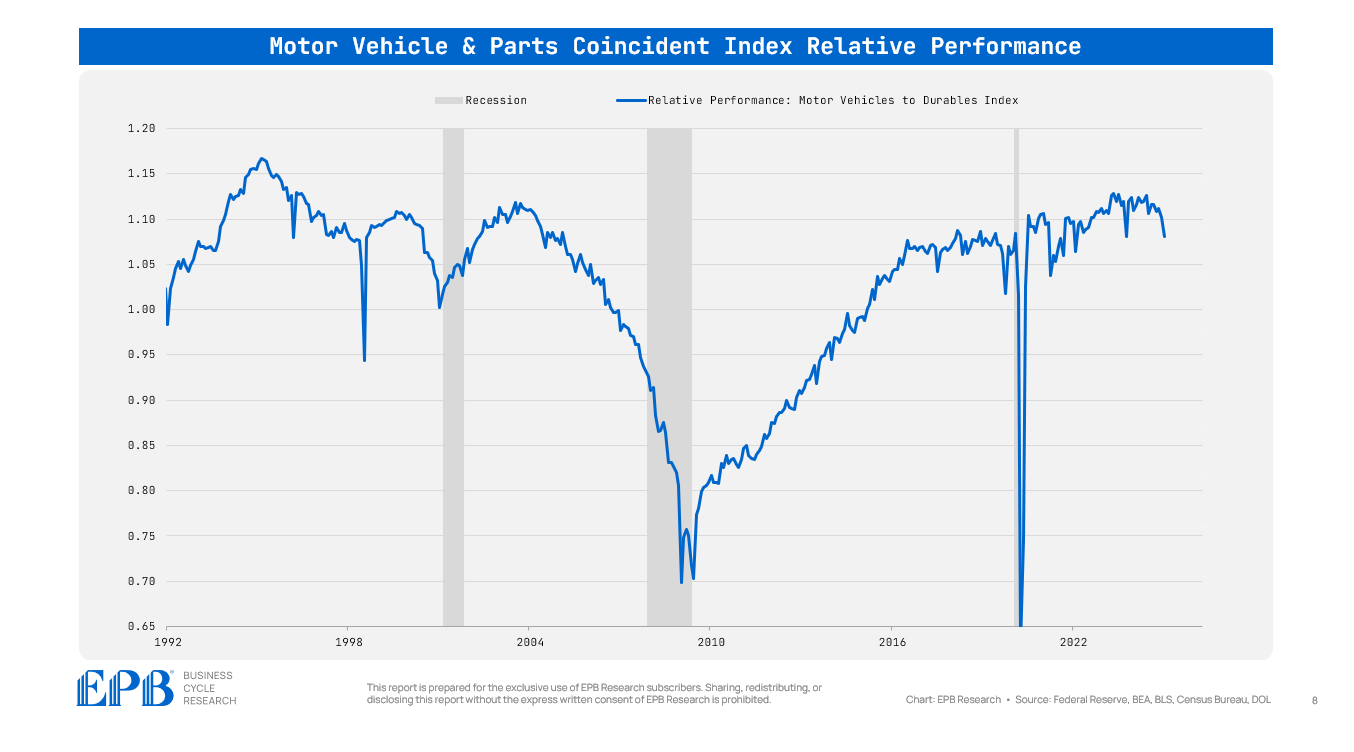
From 2021 through 2024, the relative performance of the motor vehicle manufacturing index was rising, indicating that manufacturing had a tailwind from the vehicles industry.
Now, motor vehicles are pulling manufacturing lower, a big shift in the Business Cycle.
The most important part of the Four Economy Framework is the Cyclical Economy, which is comprised of construction and manufacturing.
Within manufacturing, durable goods is the real swing factor and motor vehicles is the most important narrow sector.
Using of Coincident Indexes
At EPB Research, we create and track many composite indicators for each of the Four Economies as well as dozens of sectors like durable manufacturing and sub-sectors like motor vehicle manufacturing.
The chart below shows a graph of all the durable manufacturing sub-sectors and the trailing growth rates, sorted from left to right.
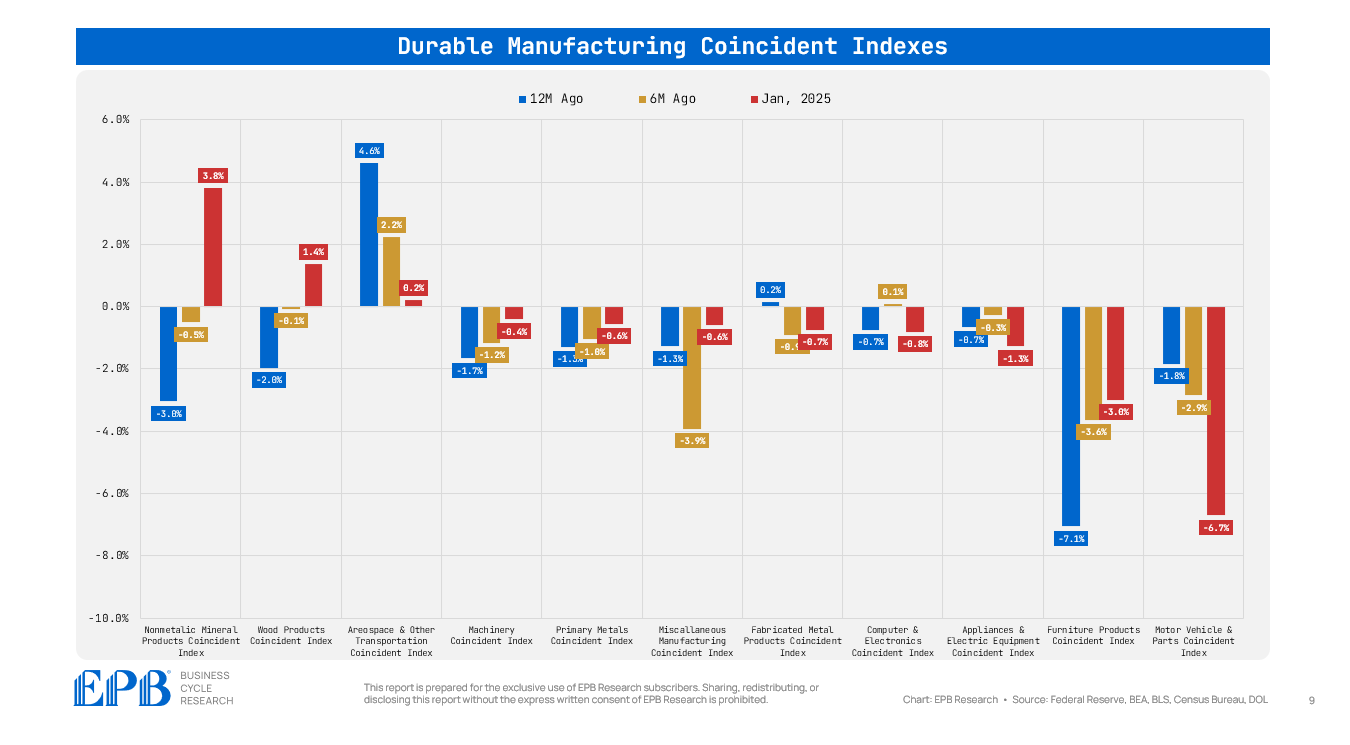
The chart highlights that of all the durable manufacturing sub-sectors, motor vehicle and parts manufacturing is performing the worst - a key signal that the overall manufacturing sector has a drag from the most important industry.
This post was about diving into the details of the manufacturing sector.
In the next post, we’ll cover the most important part of the construction sector - residential construction.
After that, we’ll move on to the Aggregate Economy, the third step in our Four Economy Framework.
If you’re interested in these indexes, as well as a structured and repeatable process for tracking the Business Cycle, click the link to learn more about our Business Cycle Research services for investors and corporate management teams.
If you found this post interesting, please share it, and don’t forget to enter your email below so you receive the next article in your inbox!
Eric is like Lou Loomis in Caddyshack (caddy boss) watching the ball teeter at the edge of the cup in the last scene. He will not be distracted by anything (fartcoin, Doge, meme stocks, AI).