


The (Cyclical) Economy Leads Earnings
Stock prices are no longer a leading indicator. This post provides empirical evidence behind how the Cyclical Economy leads company earnings which leads stock prices.

In our last several posts, we reviewed the sequential Business Cycle process that we use at EPB Research, called the Four Economy Framework.

In the links below, you can read the Sequence Overview, the post on the Leading Economy, and the post on the Cyclical Economy:
We also spent extra time digging into the industries within the Cyclical Economy, namely construction and manufacturing, since this is the most important part of the entire Business Cycle.
The cycle lives and dies by the Cyclical Economy.
We have not yet moved on to a detailed analysis of the Aggregate Economy - the part that actually defines recessions and expansions, because we need to further address the importance of the Cyclical Economy on asset allocation or business investment decisions.
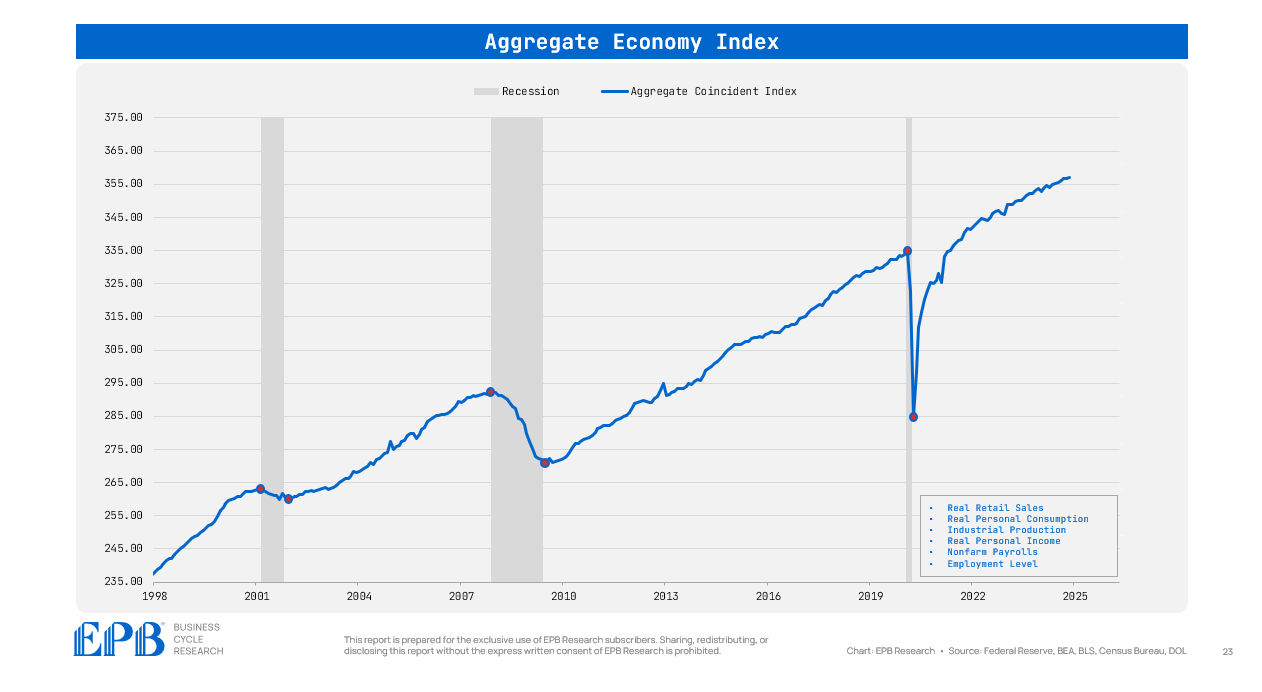
The chart above shows the Aggregate Economy with red dots to mark the absolute peak and trough in the index. The peaks and troughs of the Aggregate Economy Index line up exactly with the start date and end date of recessions.
For this reason, if you only focus on Aggregate Economy indicators like nonfarm payrolls or personal consumption, it is impossible to be ahead of the cycle - you can only tell peaks in hindsight.
Similarly, this is what gives many investors the idea that stocks lead the economy. They see stocks peak a few months before a recession on average, and therefore, stocks lead the Aggregate Economy. This is true.
However, stocks do not lead the Cyclical Economy, which is the most important part of the sequence.
Monetary policy tightens, which triggers a decline in the Cyclical Economy. The decline in growth and employment of Cyclical Economy sectors then starts to feed into company earnings.
Only once the people who have become unemployed in the earlier sectors of the economy put enough collective stress on the more lagging services sectors does the Aggregate Economy start to contract. At this point, the recession is already in progress.
We constantly measure and sequence our Four Economy indicators to get the best idea of where the cycle is today.
The Cyclical Economy, as the chart below highlights, peaked in January 2023 and currently sits at the same level today as late 2021. These are important dates in the context of asset performance.
The Aggregate Economy continues to march along as the downturn in the Cyclical Economy is not deep enough.

There are many different assets in the investable universe, from real estate to stocks. But even within real estate, or within the stock market, a further spectrum emerges from residential apartments to shopping malls and from small-caps to large-caps. Every asset moves at a different part of the sequence.
Some assets are highly economically sensitive and move very close to the Cyclical Economy depicted above.
For example, the Green Street Property Price Index highlights that commercial real estate has been down since April 2022, similar to the Cyclical Economy.

And it's not just office. All the sub-sectors, including apartment, are down nearly 20% from peak values in 2022.

Small-cap stocks, like the Russell 2000, track the Cyclical Economy, offering no gains since early 2022.

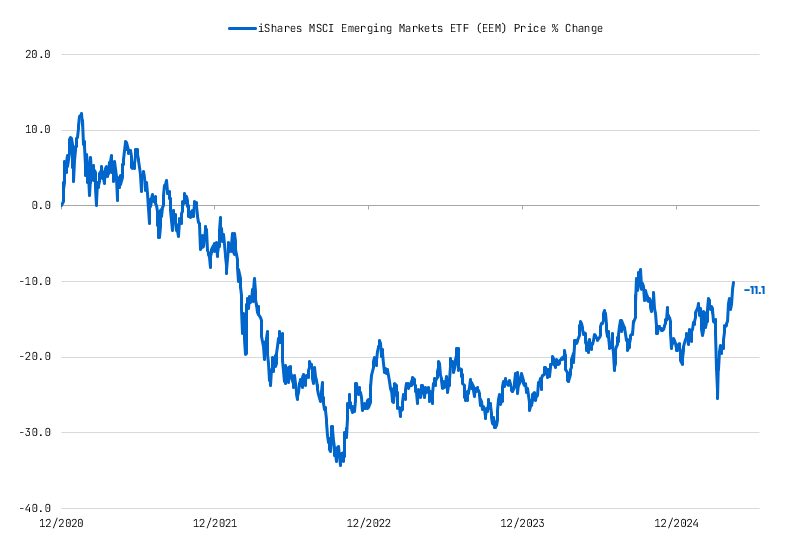
Emerging markets are another highly cyclical investment, down since 2021/2022 as well.
The 2-year Treasury rate, which seeks to forecast the Fed Funds rate, is down with the same contours and the same rolling peak as the Cyclical Economy.

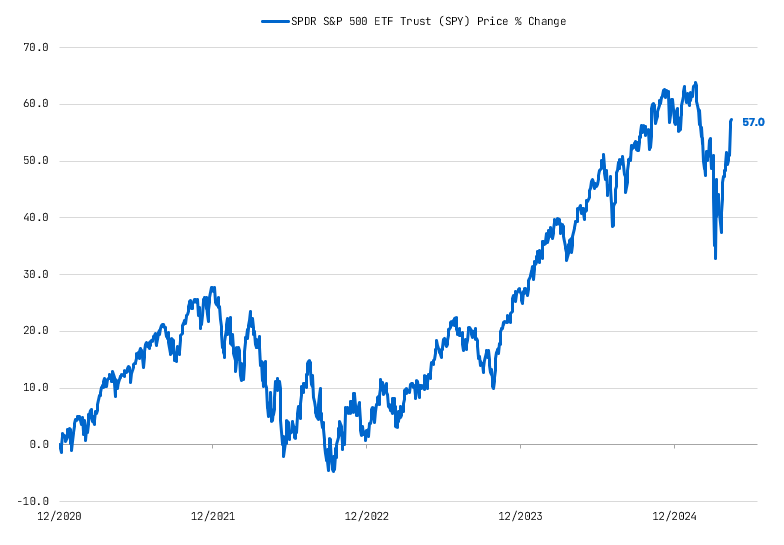
Blue-chip stocks, however, like the S&P 500, track the Aggregate economy much more closely as the major companies are services-based, monopoly-like in nature, and are not interest rate sensitive. It takes an Aggregate Economic downturn, or a recession, to cause significant and lasting declines in blue-chip assets.
By synthesizing these sequential trends, the framework provides a repeatable, consistent, and structured way to approach the economic environment and resulting investment decisions.
While no single indicator tells the full story, creating buckets of indicators that all move at the same time in the overall sequence creates a more robust way to analyze the economy.
How has the Cyclical Economy performed relative to earnings in past recessions?

In the last three Business Cycle recessions of 1990, 2001 and 2008, the Cyclical Economy peaked and declined in advance of S&P 500 earnings. In the 2008 example, the lead time was significant.
So it’s not accurate to say stocks lead the economy.
It’s conclusive that several critical sectors of the economy move first, and it’s this stress that causes the decline in earnings, stock prices, and broader economic pressure.
Every investment is different, and nuance is required.
If you had to bucket "asset prices" into one large group, you would conclude that asset prices move between the Cyclical Economy and the Aggregate Economy.
Some investments are more sensitive and track cyclical movements more carefully, while more "blue chip" investments lean closer to the Aggregate Economy.
Today, as depicted, the Cyclical Economy has rolled over, lower than January 2023, and pressure is likely to remain as the Leading Economy is still in a downturn. This suggests that cyclical or economically sensitive assets will continue to underperform.
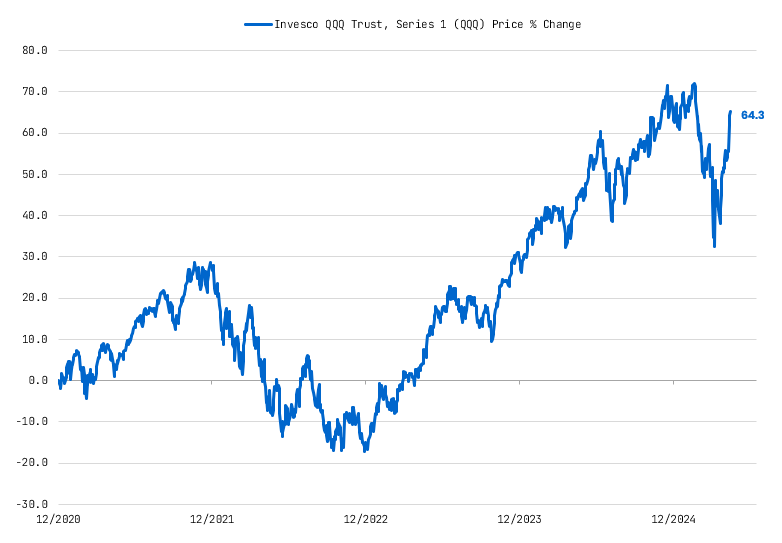
The more blue-chip and defensive investments, like the S&P 500 or the Mag7 heavy Nasdaq, have a window to continue outperforming because Aggregate Economic activity continues to march along.
If you found this valuable, you’ll get even more from our full macro research service and platform.
Superb!
Thank you so much for your articles, reread all of them.
I can't understand only one thing: how your framework relates to ISM, which is also called the business cycle?